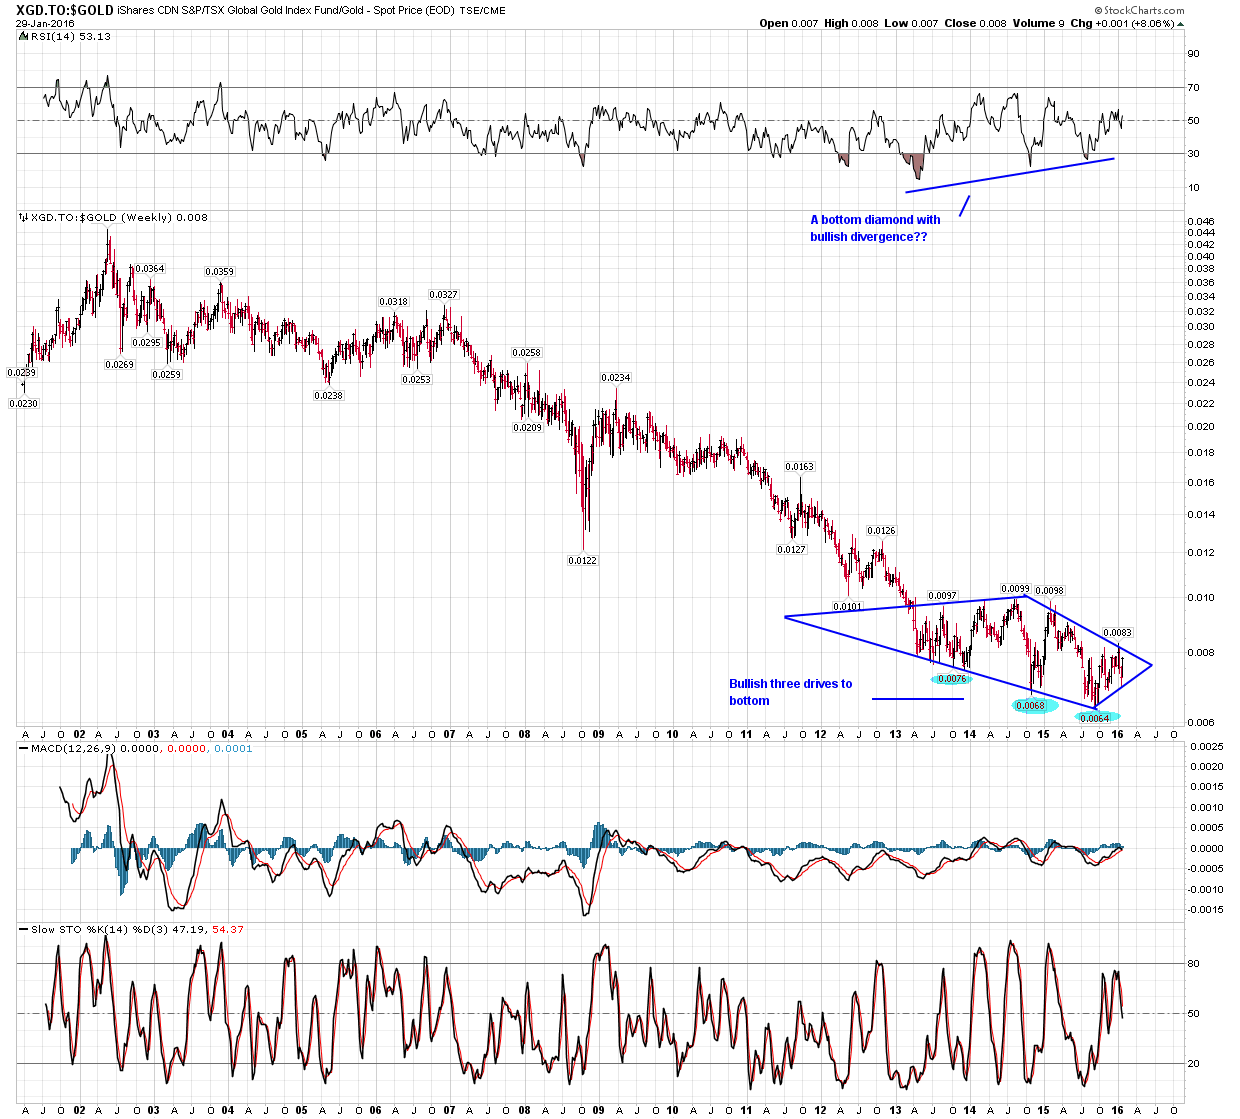
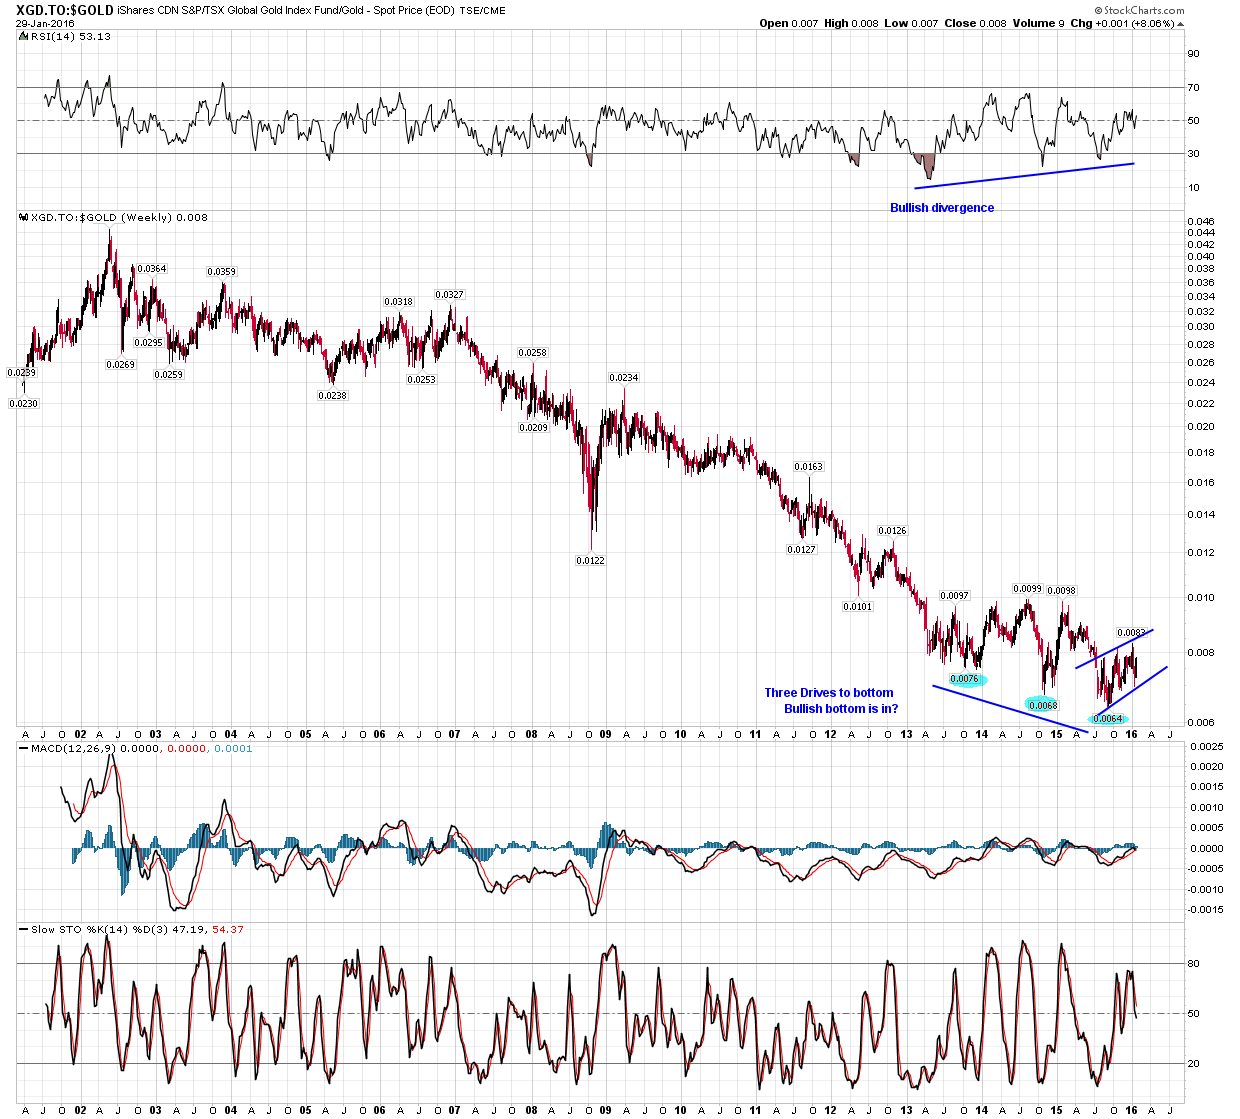
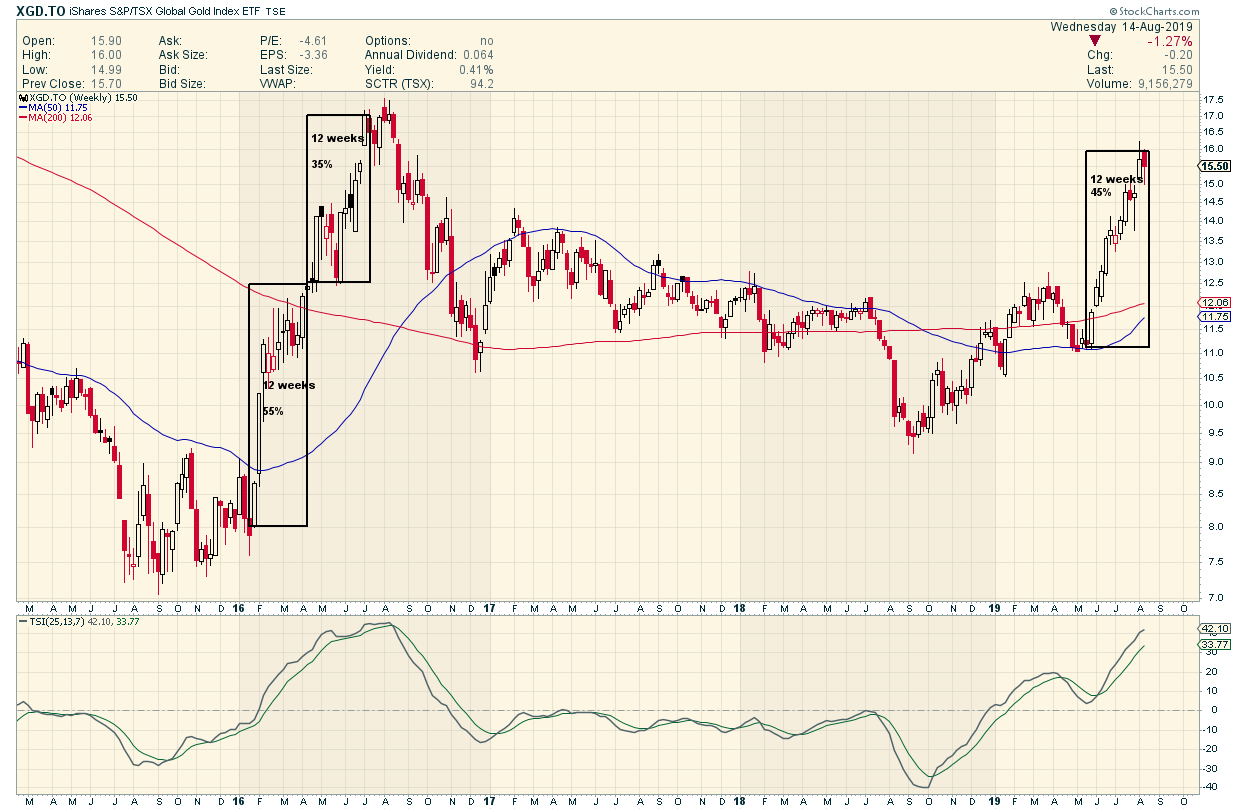
XGD to Gold Weekly In Bull territory

Large Cap Canadian Listed PMs
Has been leading all the way
The ratio has possibly put in the bottom with three drives to bottom and flat triangle. Once the ratio breaks out the top flat line PM sector will be in bull trend confirmed.
Junior producers will have great leverage to POG. Time has come to make 10 to 100 baggars in juniors.

This ratio tells more convincingly that bottom may be in.
– Bullish divergence with RSI
– Bullish three drives to bottom with lower highs and needs confirmation to make a new high on weekly.
– Diamond bottom on weekly. Needs break out soon??
All above has not happen in last 4.5 years of bear trend.
SPOCK HAS NAILED IT AND HE IS RIGHT.


added hgd.to double bearish ( XGD.to) 3 year channel with mov avg b/t. Length of channel can be = distance of move. Armstrong spoke of gold not turning till 2028.
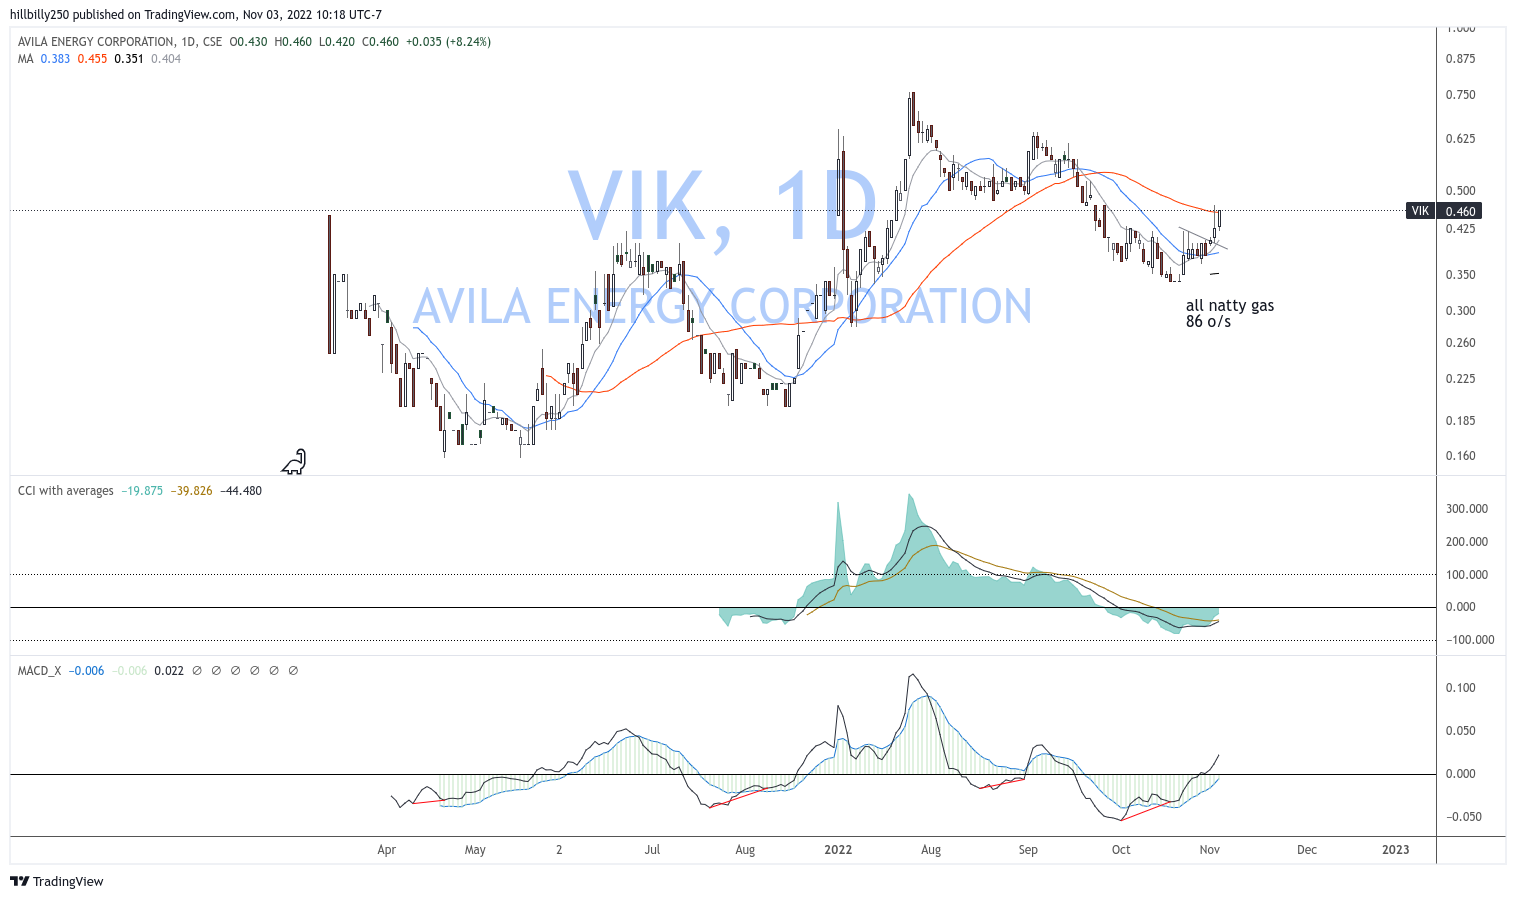
AAV natty gas play, europe begging for it. Avila energy also pure nat gas play in the works.
The Turd strikes again !
Trudeau proposing new tax on corporate stock buybacks “to encourage [them] to invest in domestic operations and workers”
Excellent story of events from boots on the ground
This is from Dennis in Ak. via email…anybody else concerned with this outfit ?
I would be curious of other people’s experience with Interactive Brokers. Wondering if they’re on the verge of going out of business. I have been trying to contact them about selling XGD.TO since before Christmas. I’ve sent them 4 emails with no replies. I tried to call them a week ago, but gave up after being on hold for one hour. Today it’s been 50 minutes, but I’m staying on the phone until I get a person on the line. It’s PATHETIC. Closing the account after I get this thing sold because of the AWFUL customer service
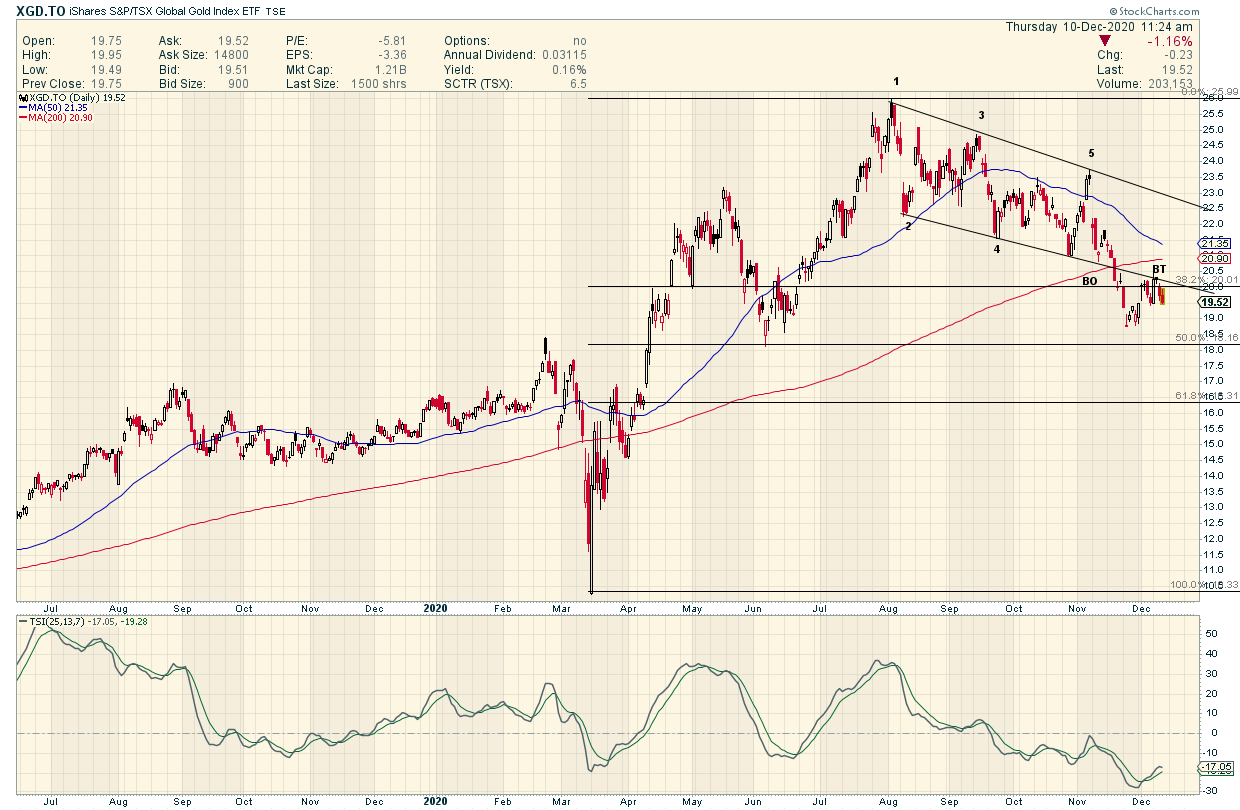
“A little over a week ago on December 8th I first posted the possibility that we could see a small H&S bottom forming at the last reversal point in the August trading range in the PM complex. Details were still pretty sketchy but there was enough information to start laying out the groundwork for how a H&S bottom could form.
December 8th.
This next PM combo chart is a 2 hour chart I just built today. Usually at the important reversal points in a consolidation pattern many times you will see a smaller reversal pattern form at the reversal points. Since we could be seeing the possible last reversal point in the August consolidation pattern I finally got enough information to layout a possible H&S bottom which is very small at the moment but could morphing into a bigger H&S bottom. We should know in the next day or 2 if the potential neckline is going to hold the backtest from above. The thick black dashed horizontal lines could be the neckline for a bigger H&S bottom but again one step at a time.”
Click twice to enlarge charts
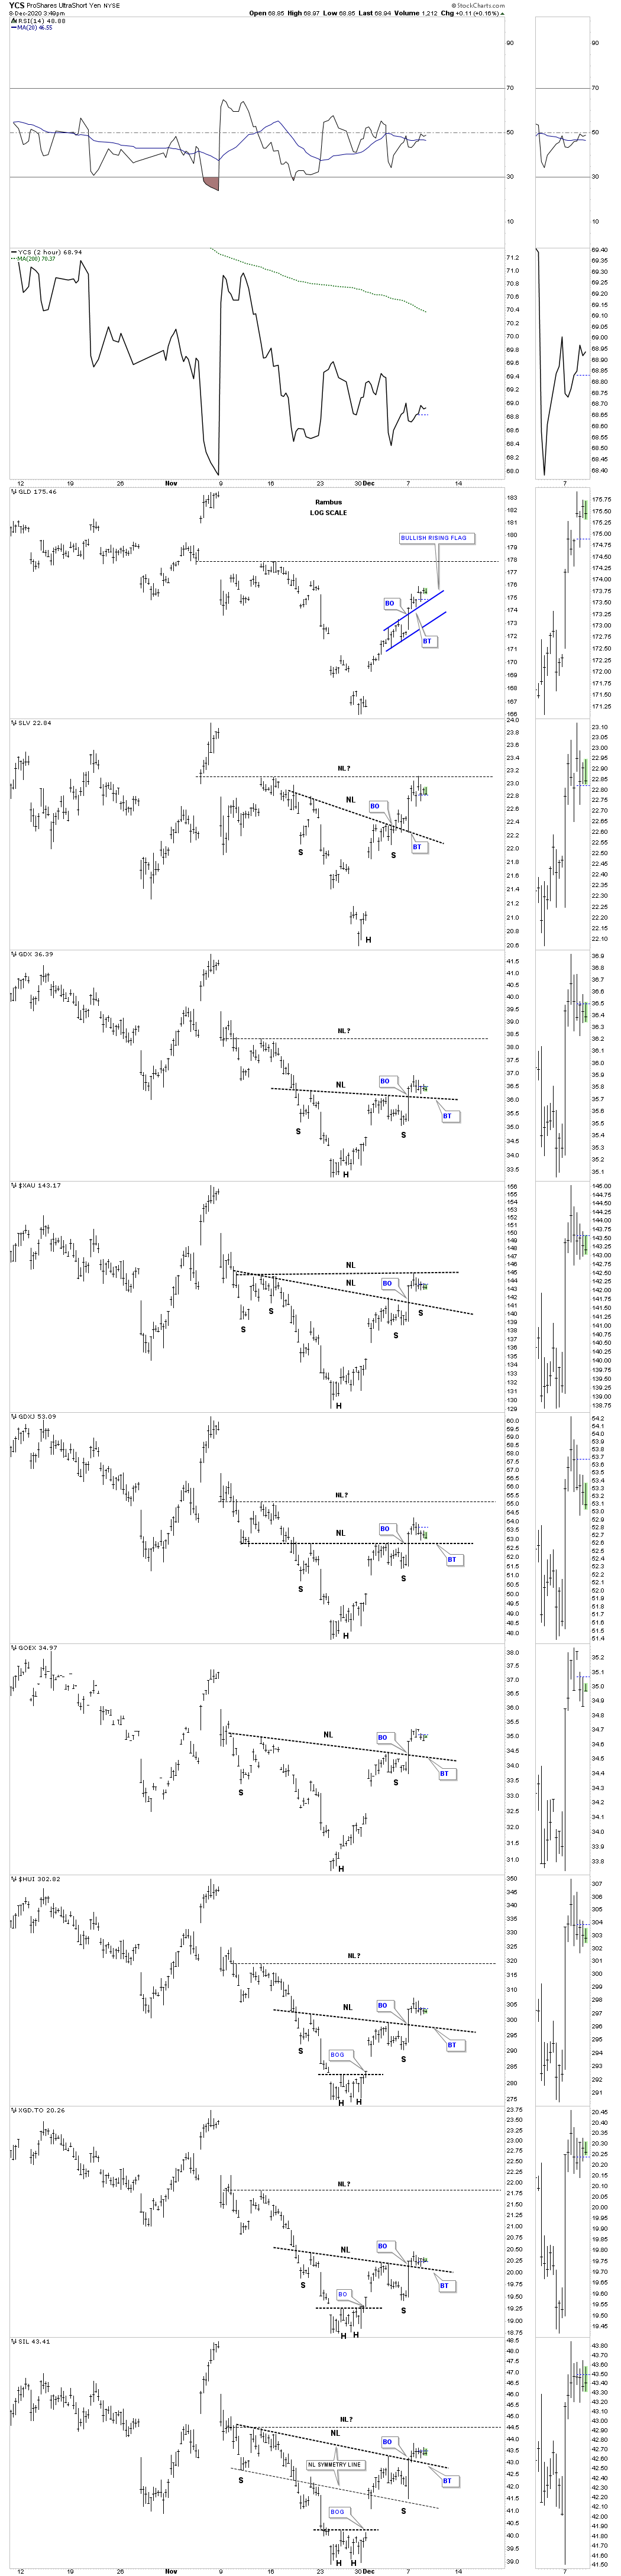
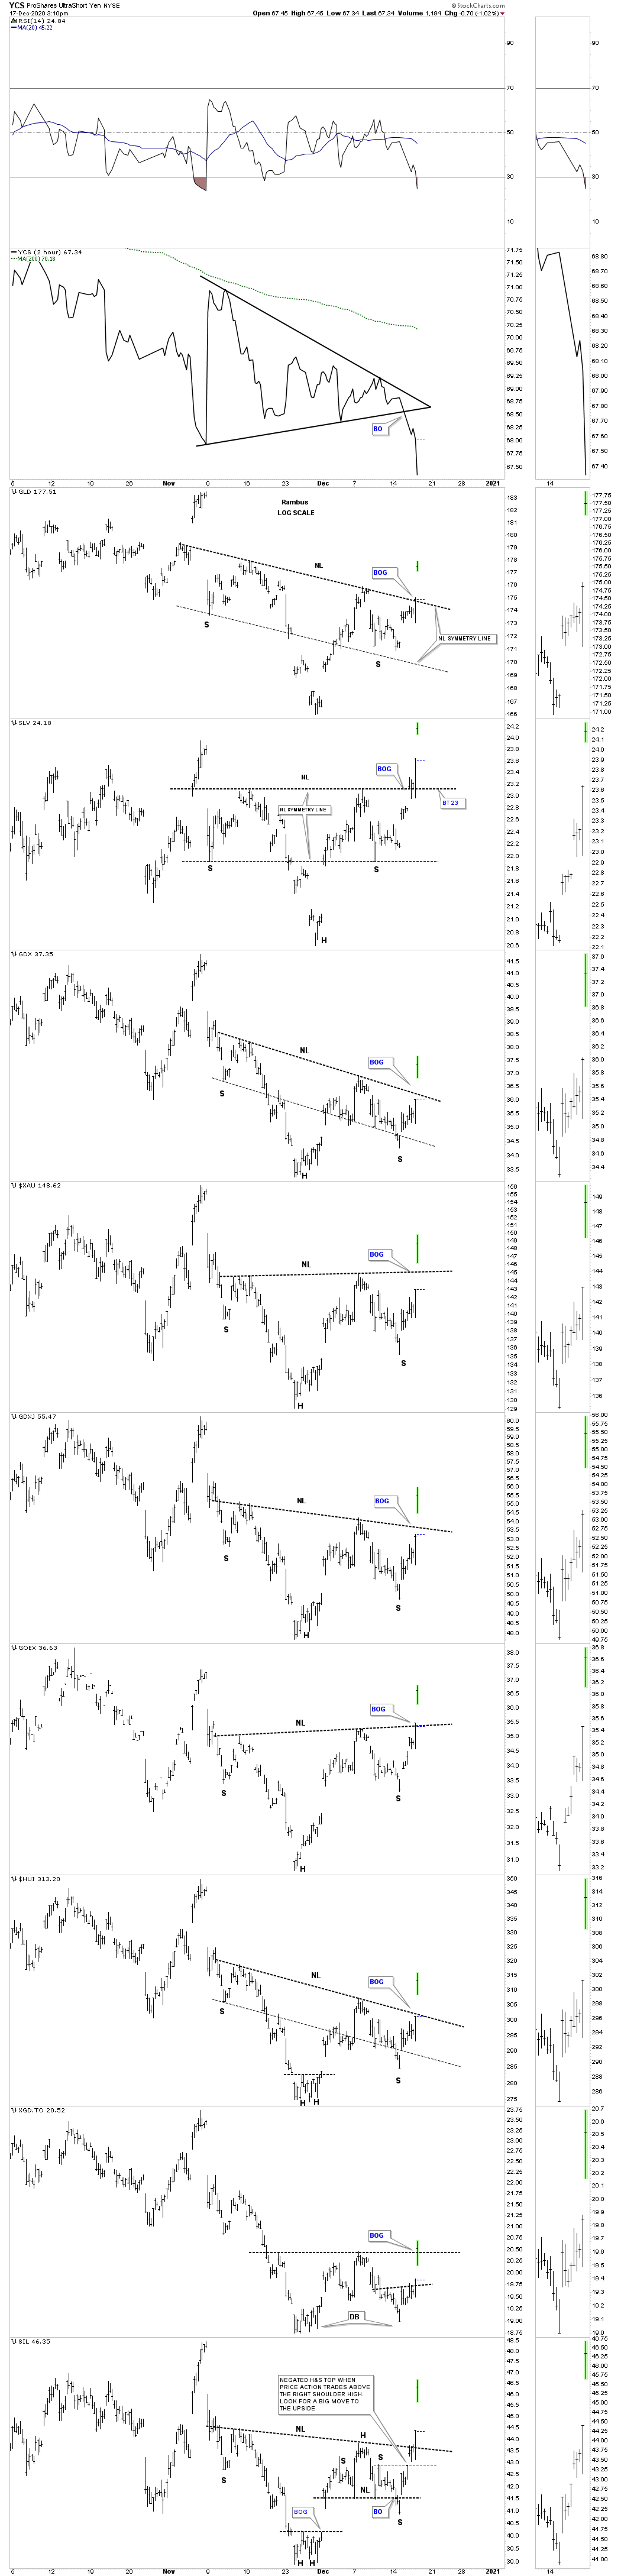
Back to the present December 17th.
Yesterday when we looked at the 2 hour chart for the PM complex SLV and SIL were the only 2 to have broken out of their very symmetrical H&S bottom with the rest trading just below their respective necklines. Today the rest of the PM complex joined the party with their own massive breakouts. What you are seeing today is a classic breakout move from a Chartology perspective. The only thing we can’t know yet is if we’ll see a backtest to the necklines. The XGD.TO wasn’t showing any type of reversal pattern yesterday which is kind of unusual. Today I was able to figure out what the bottom reversal pattern was which appears to be a double bottom with the breakout today above the double bottom trendline. Also yesterday I highlighted the price action on the SIL chart leaving the small H&S top in place suggesting that when a H&S top fails, price action trades above the right shoulder high, the H&S pattern is negated you can see a big move in the opposite direction and in this case up.
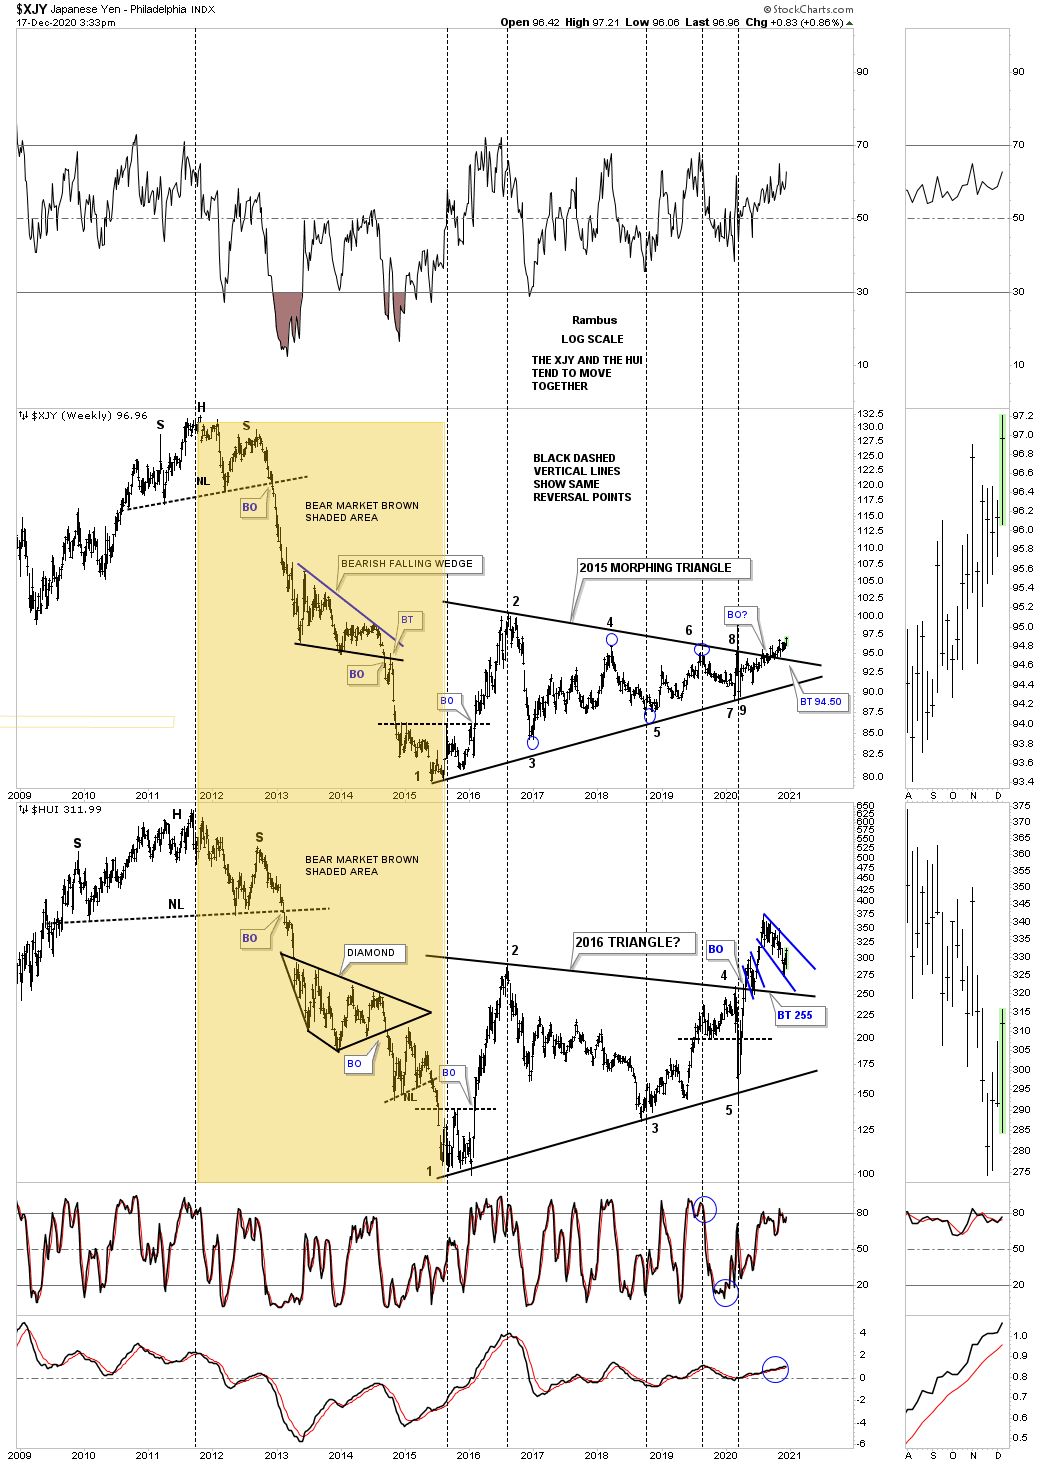
This next combo chart has the XJY on top with the HUI on the bottom which shows how these 2 tend to move together. I always state that it is not a tick for tick move but how they generally move together and how they tend to reverse together at important turning points as shown by the black dashed vertical lines. There is a bullish development this week on the XJY that is making a new higher high after breaking out from its 2015 triangle reversal pattern. The positive correlation between these two strongly suggest there are many years of bull market price action going forward.
Full Report with many Individual Set Ups here ( For members )
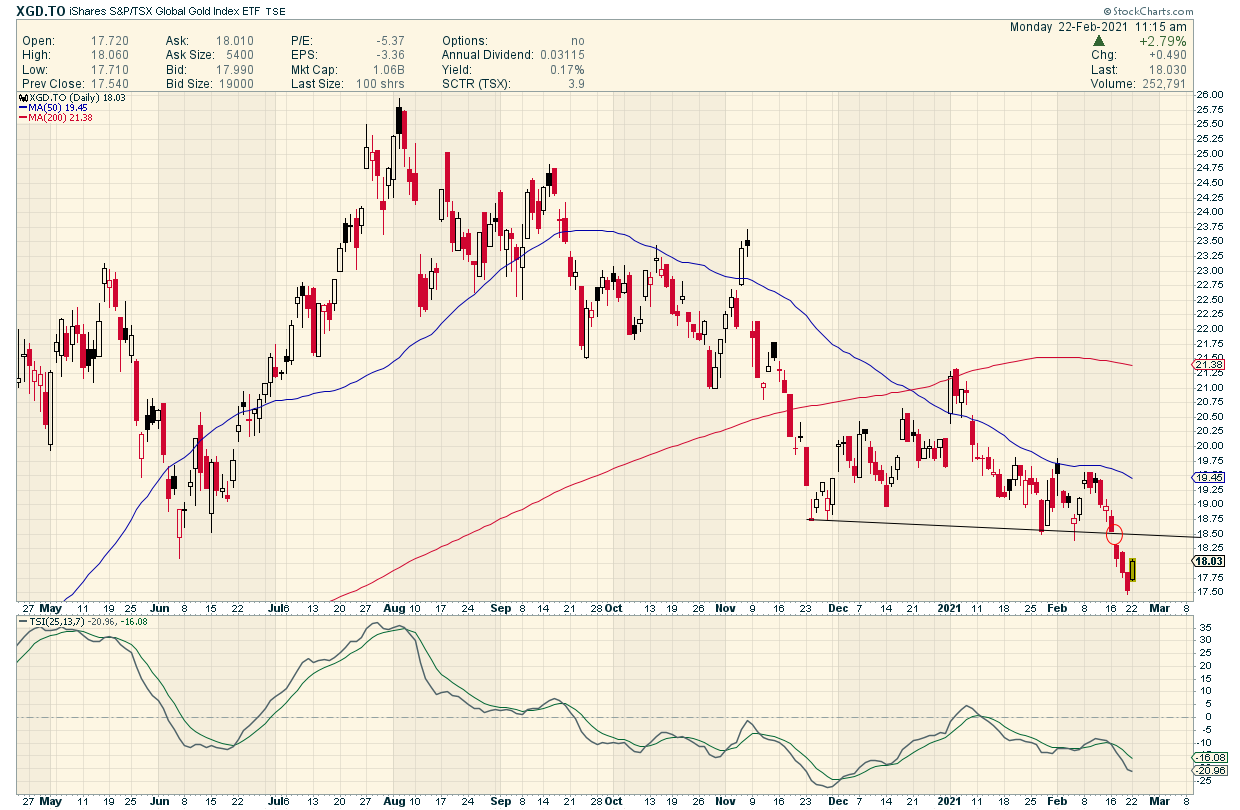
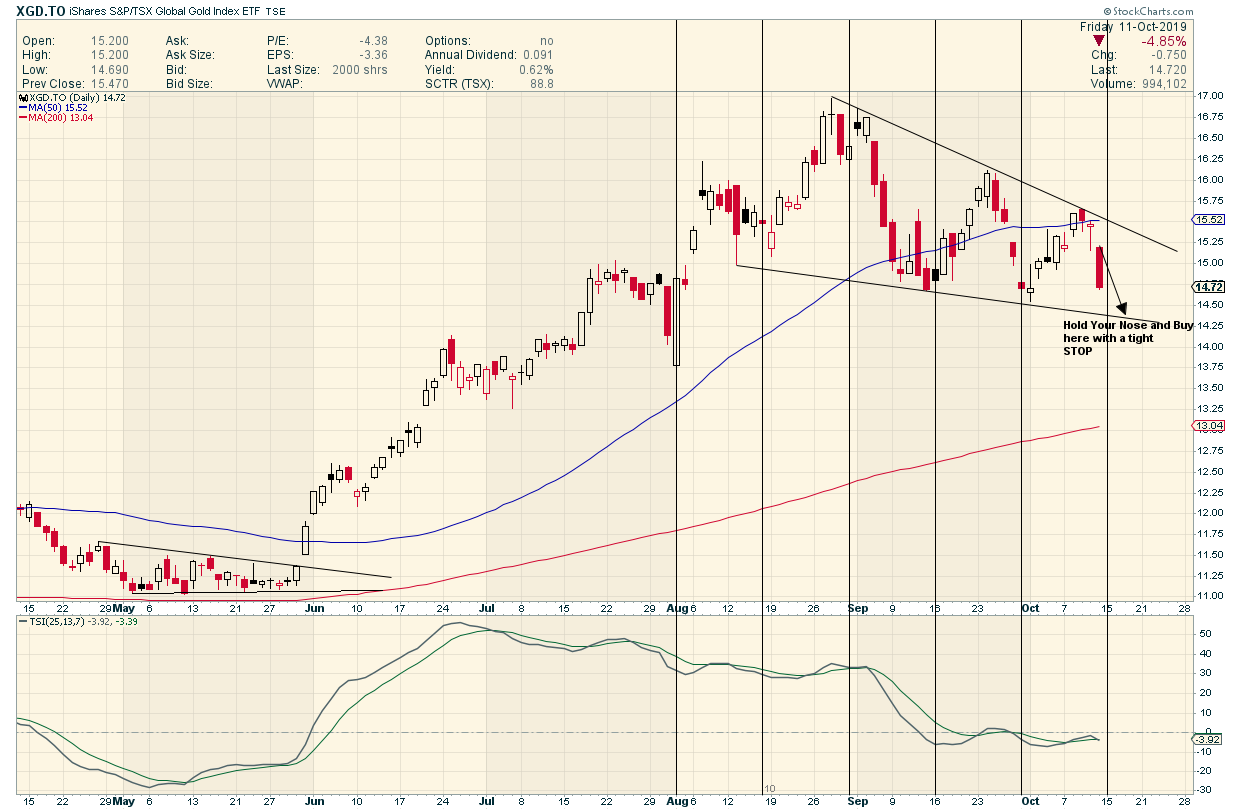
Could this be a False Breakdown that launches the Next leg up ?
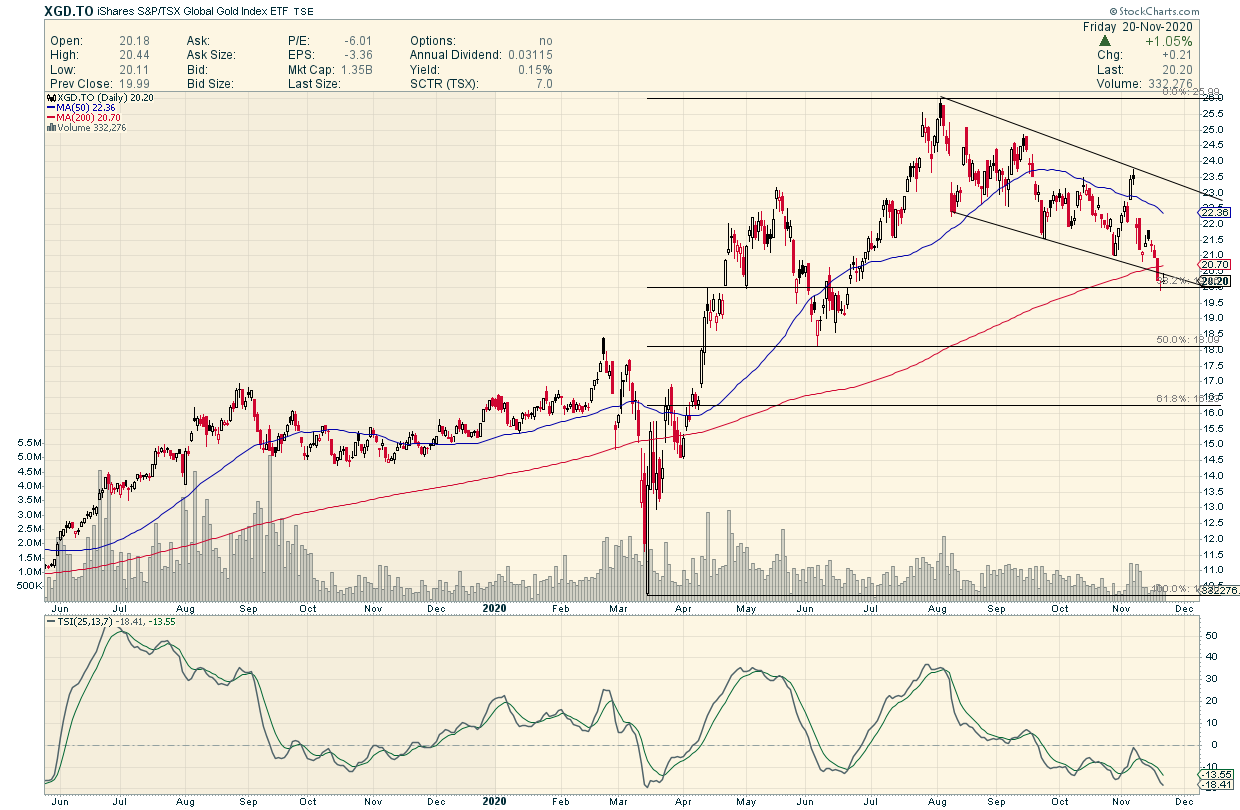
The XGD is a good proxy for the PM Miners. It usually has crisp chartology
It is the only PM Index to have broken down…the others are still in the pattern
Fingers Crossed that this reverses and we get a sling shot move.
This “correction” has been like Chinese water torture for PM Miner Holders
Damn China again
🙁
Some Elliot wavers are calling this pullback in the PMs an ABC correction. If it is then the pullback in the miners should already be complete.
However, the breakdown at support and retest (so far) of the S/R line implies more pain to come.
The miners need to close convincingly back above the S/R line for a bullish outcome.
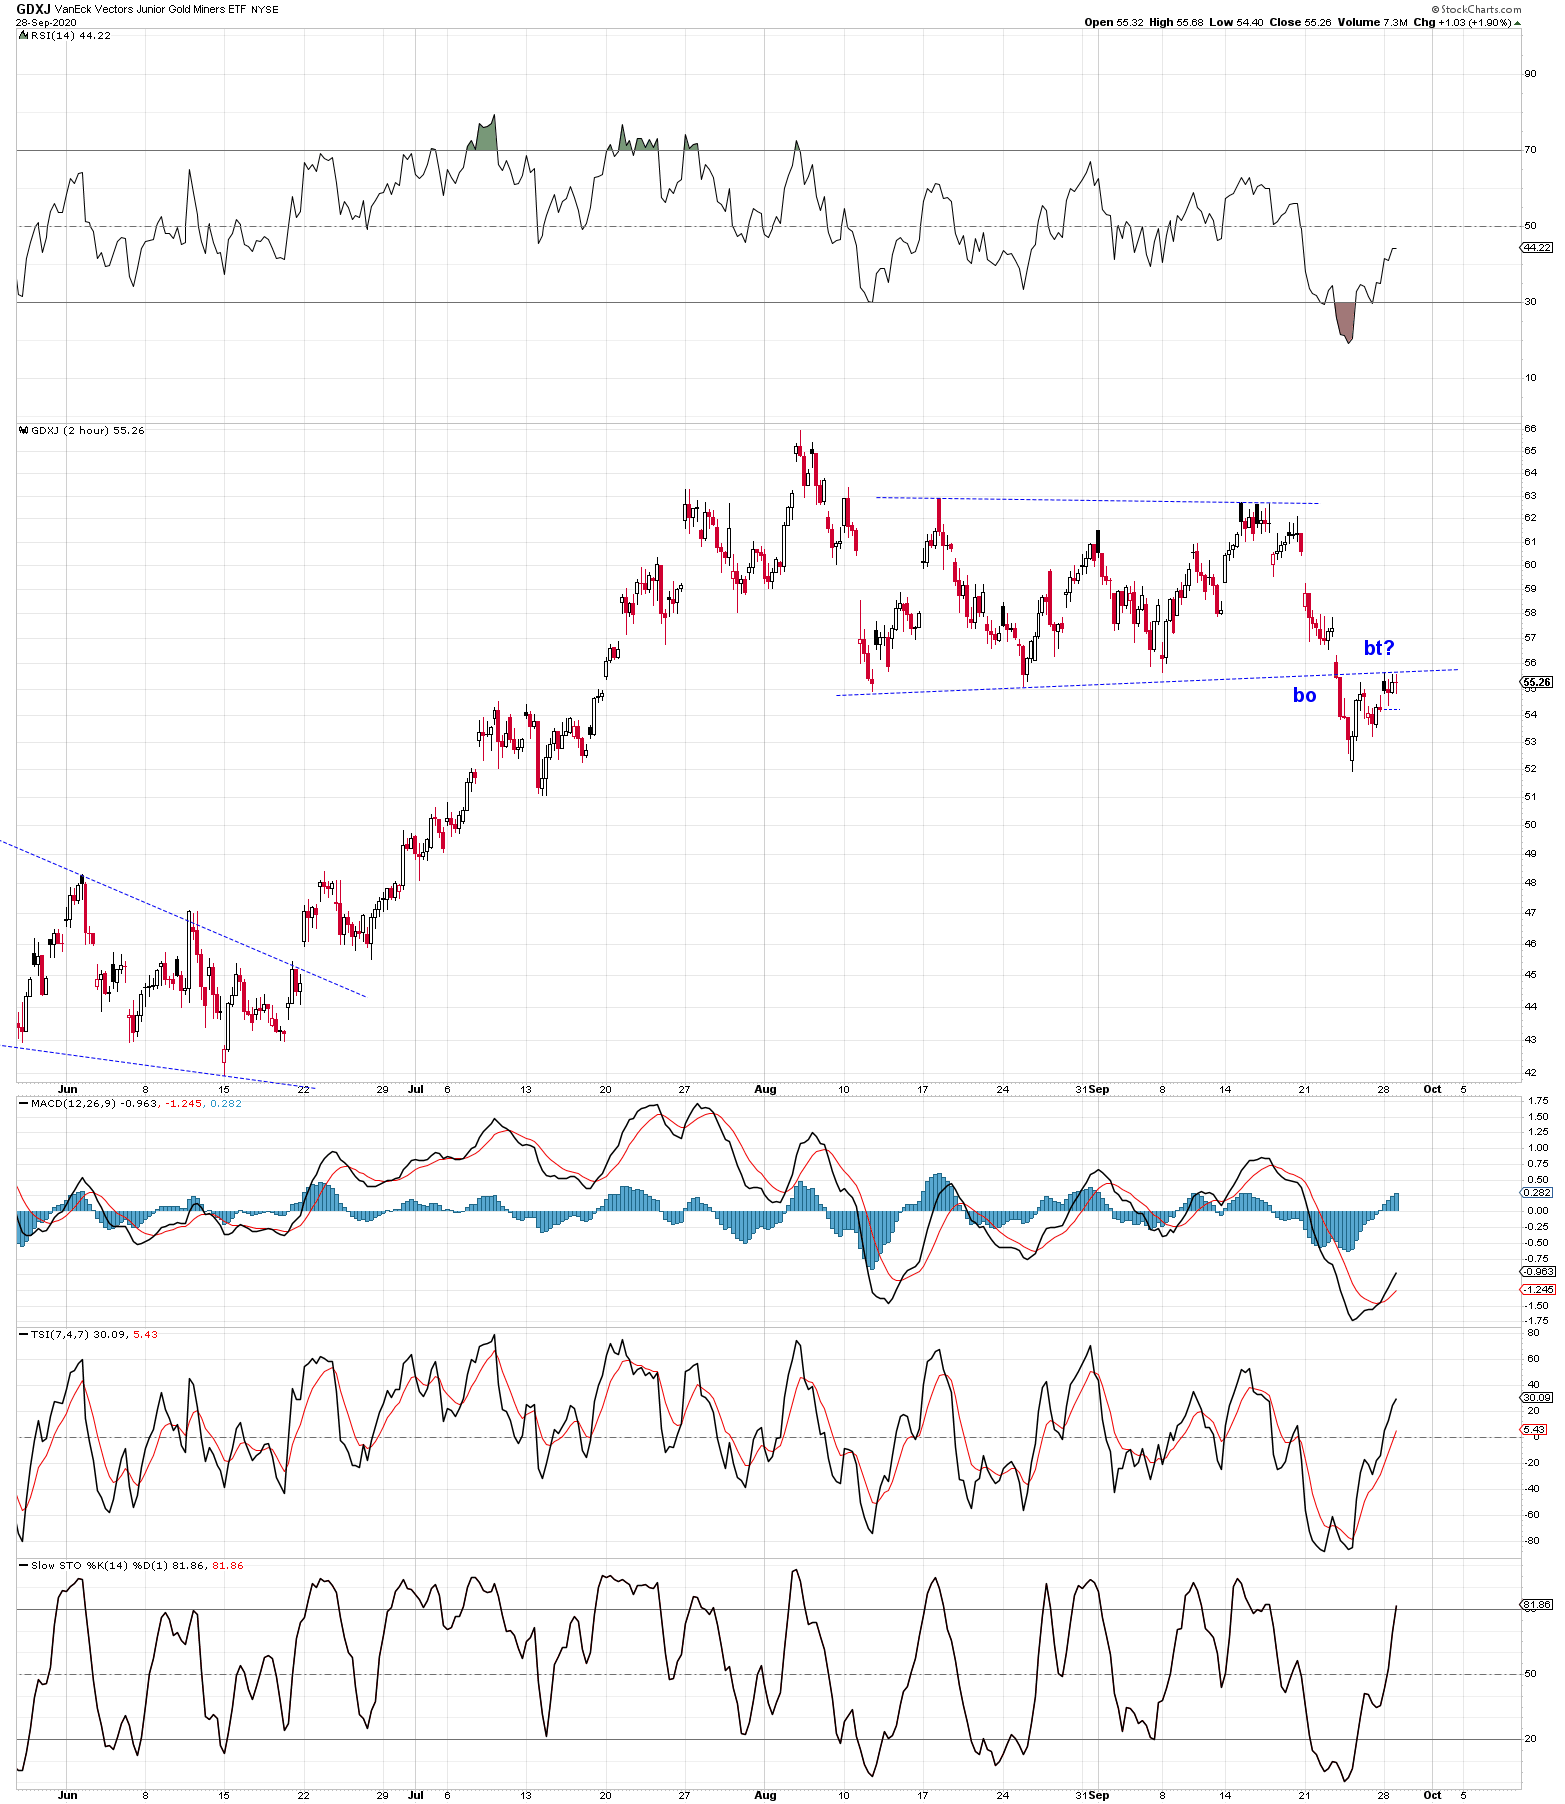
GDXJ – 2 HOUR
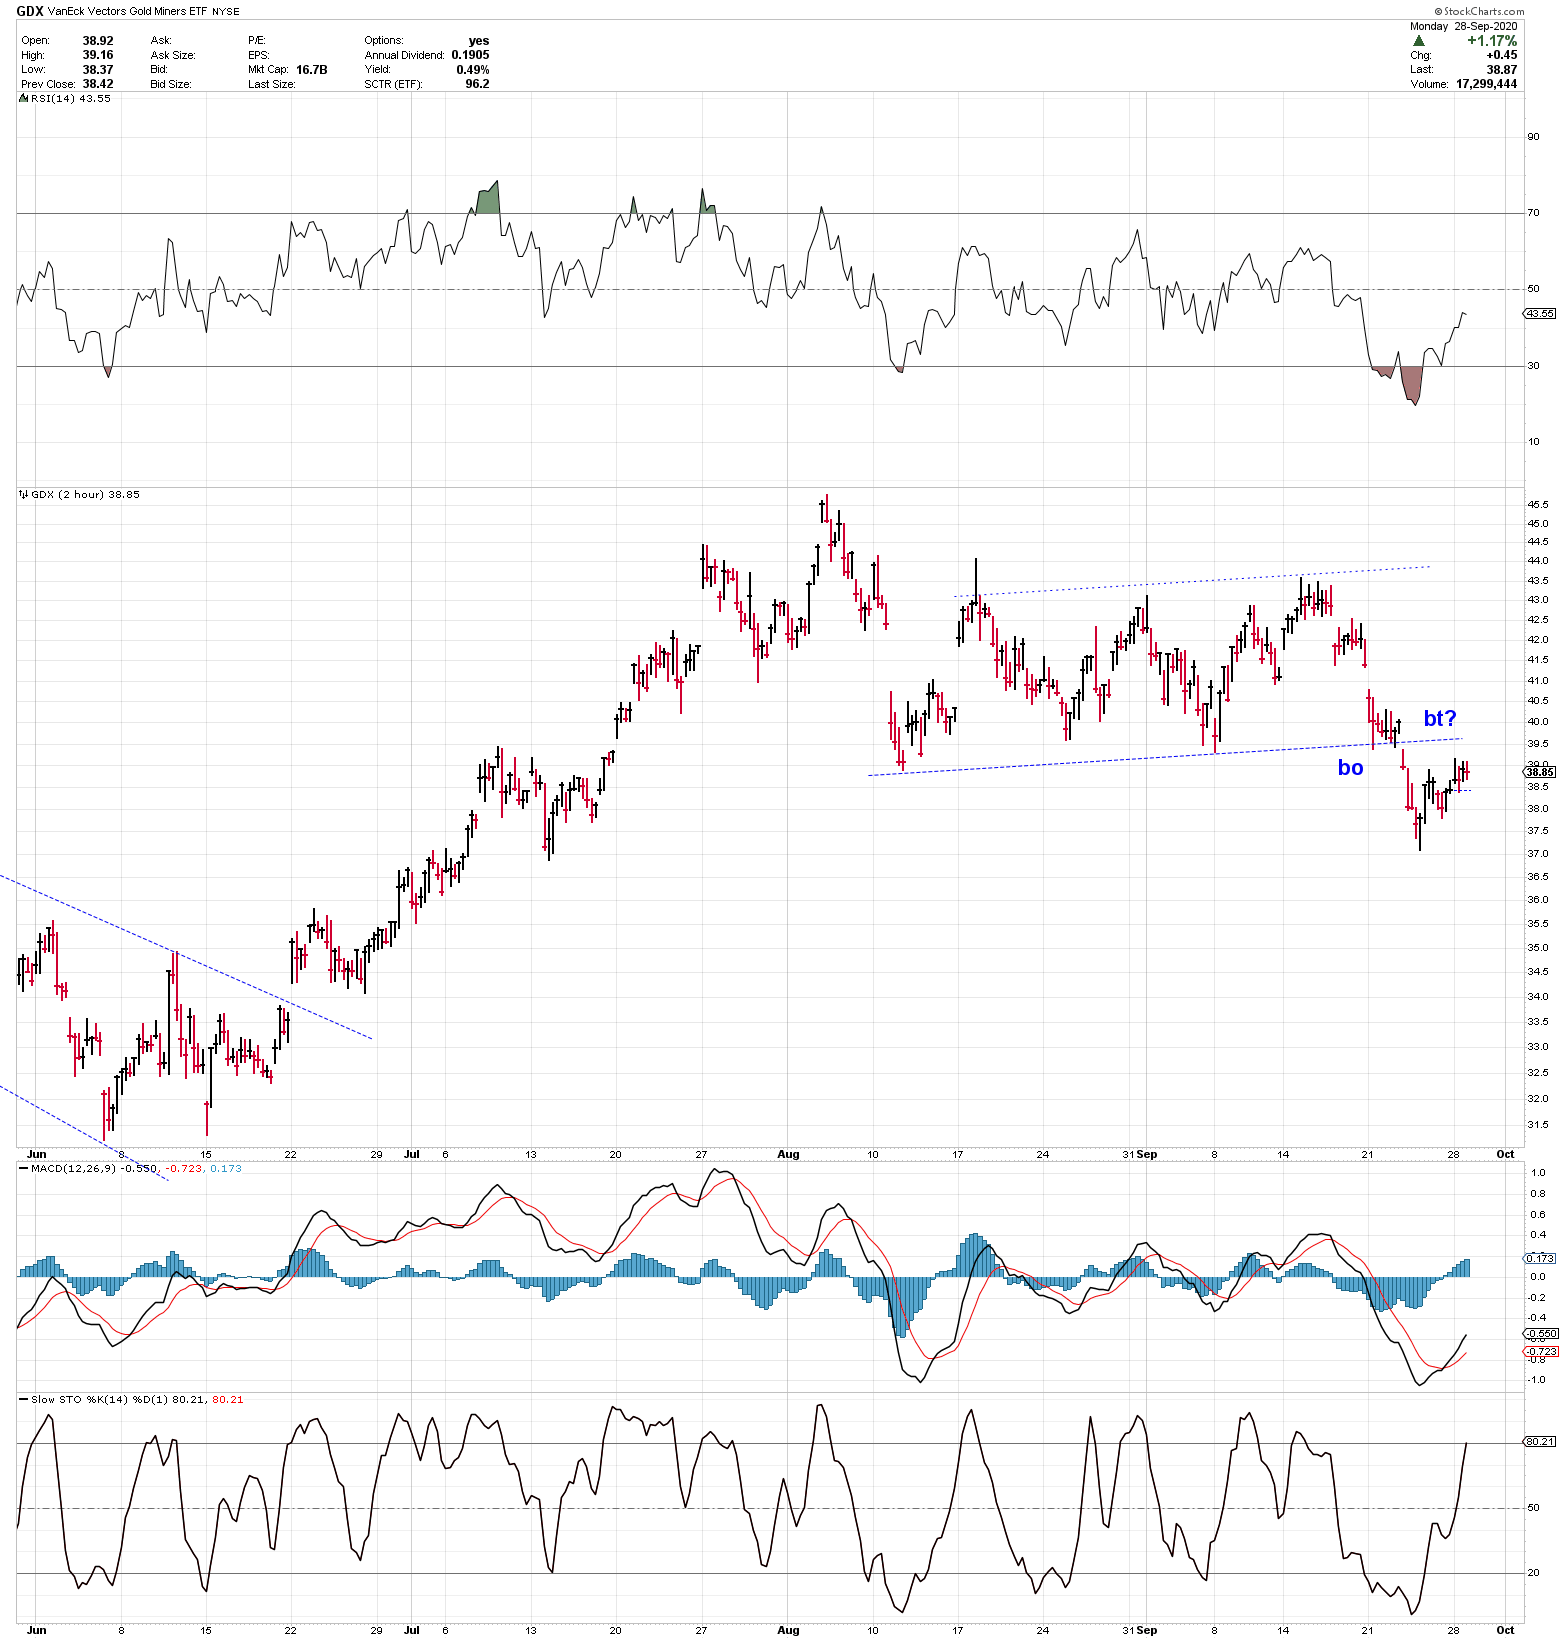
GDX – 2 HOUR
XGD.TO – 2HOUR
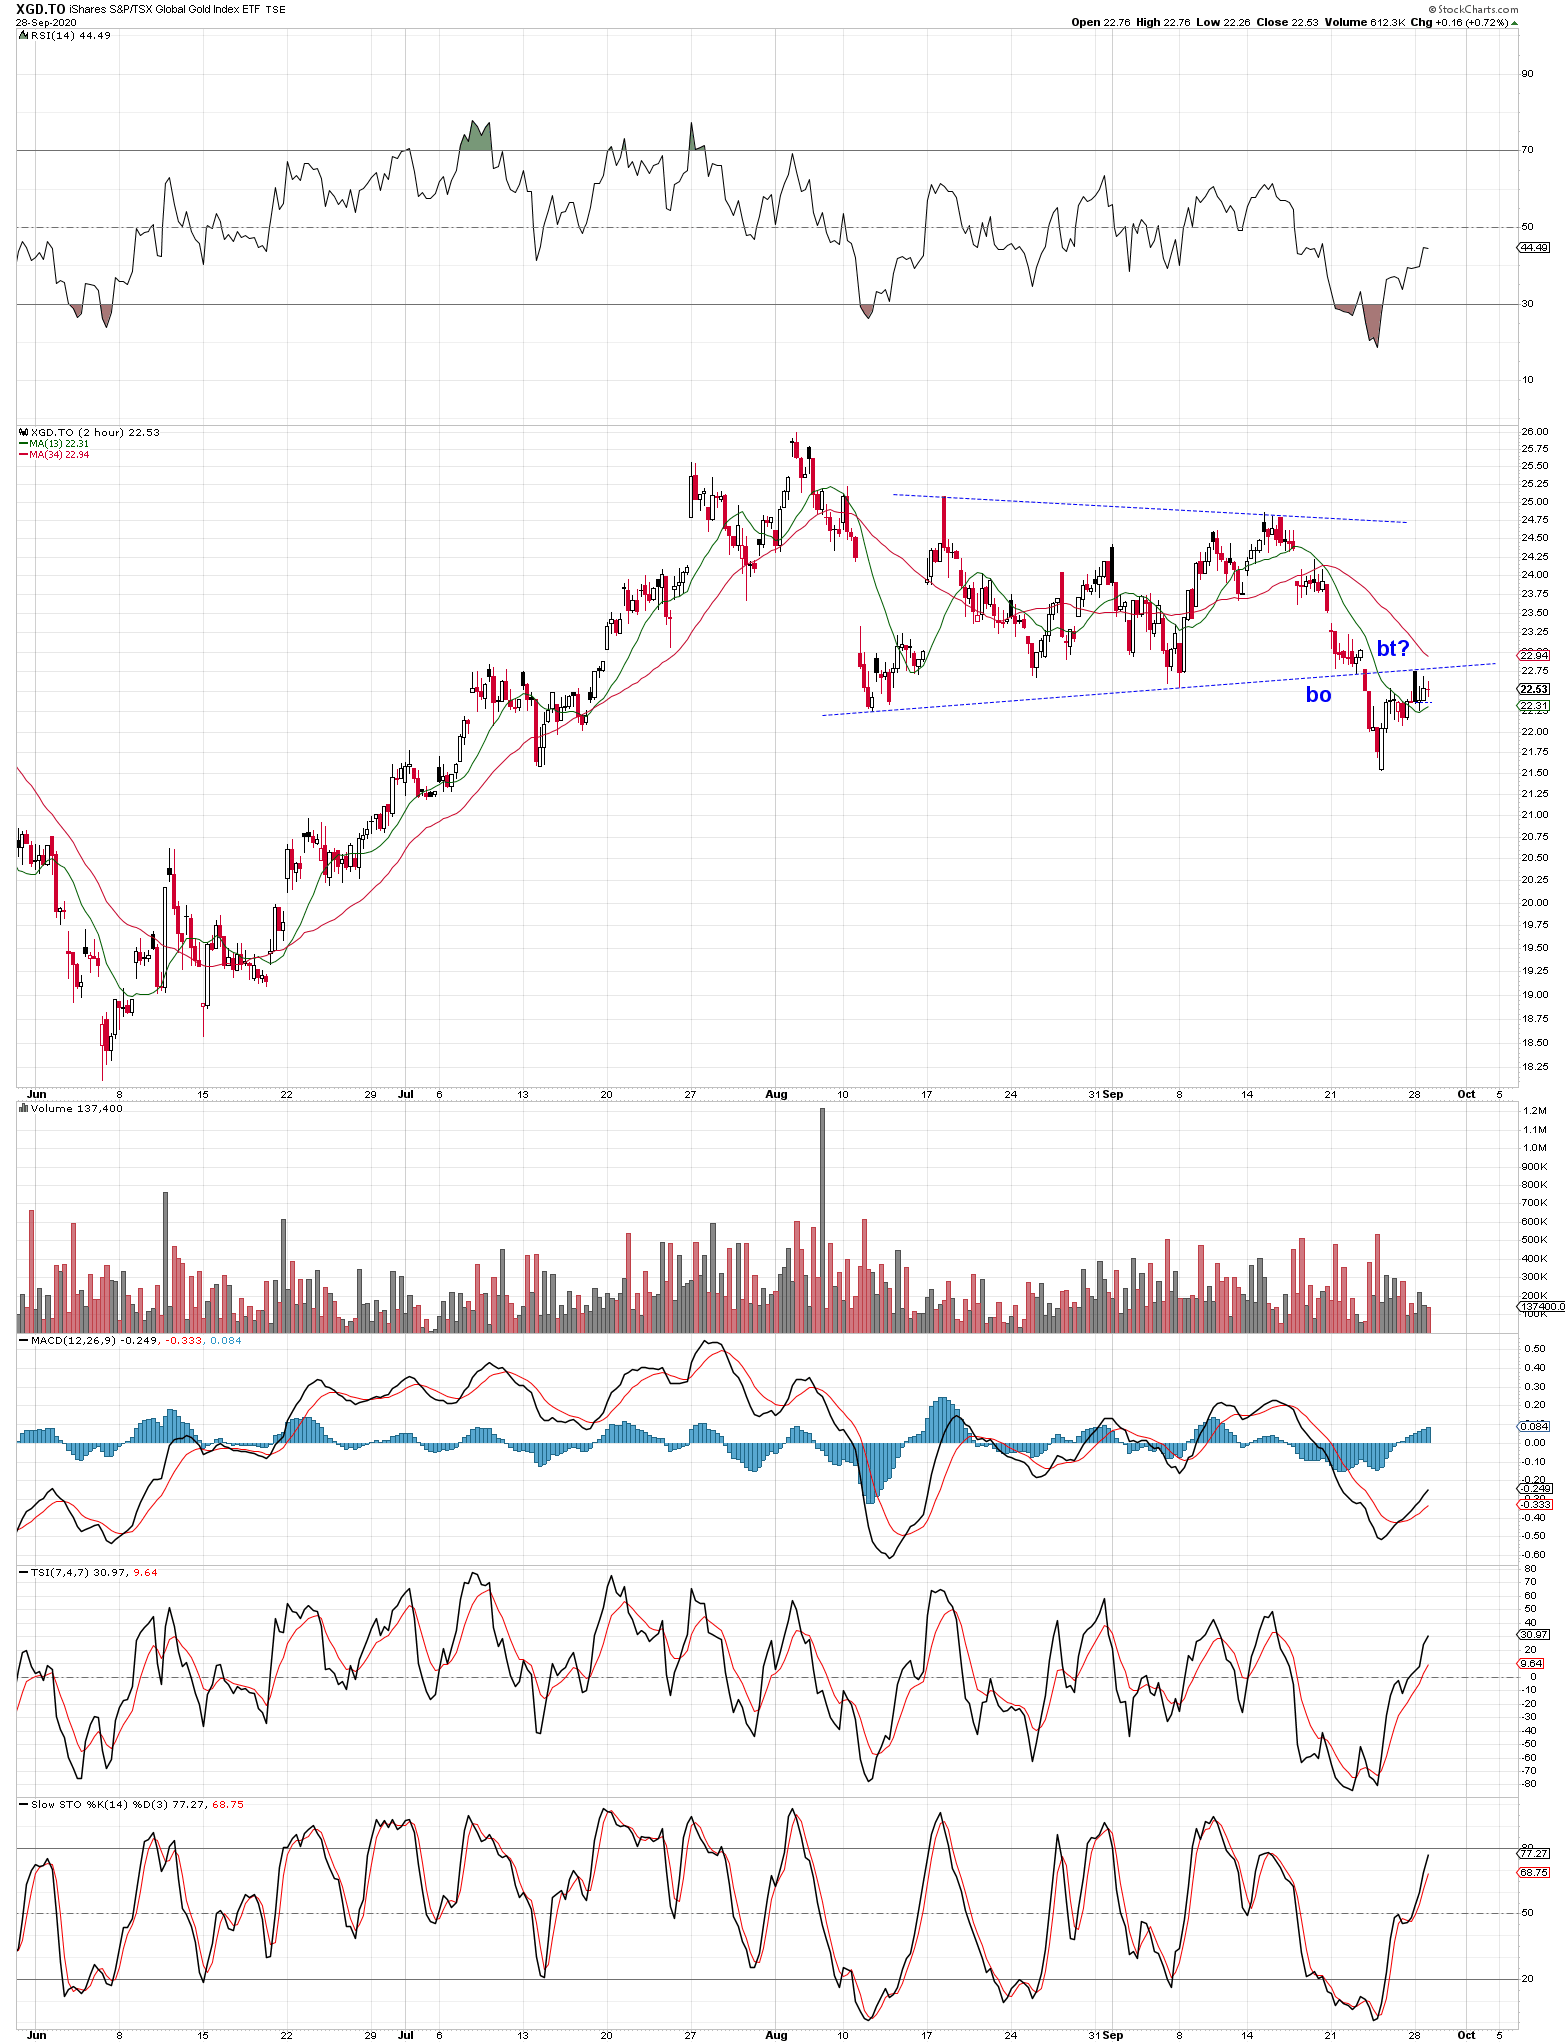
To have a chart like this after the last 2 days in the PM market…..SUX
This is why I am sticking to the XGD ETF.

Cant compete with all these great Bowls from Northstar and now Patrick
BUT I do have a Sickle to offer
This one is a beauty and shows why it seems like we are going nowhere
Which way will it break ?


“Look familiar?”
Absolutely brutal to see PM Stock Indices down hard today with little movement in Gold and Silver Up.
Unfortunately this is usually a precursor for bad things to happen.
Plus General Stocks are on the verge of a BIG breakout.
IMHO Cash is a good place to be until this resolves.
watch this
Hi Sir Hawk
For your recent request a perf chart for the various PM ETFs since the June 1 Low.
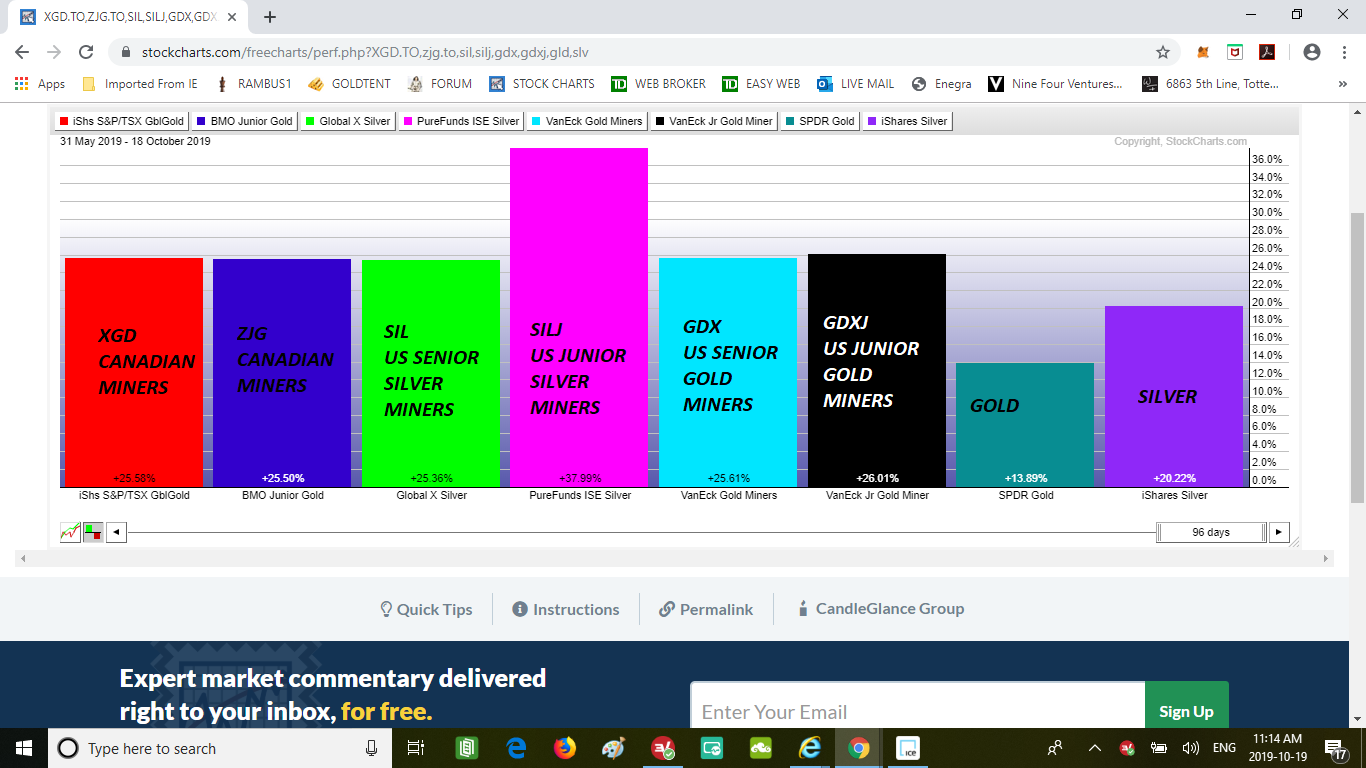
Can’t go wrong with any of these.
I trade XGD and ZJG because I have Canadian $ Accounts.
AND I love the Components.
I challenge anyone to beat the results one can get from just buying these ETFs vs buying 10 or 20 or 50
PM stocks ….the more you have the more you pay In commissions and the harder it is to bail when things go bad.
It is certainly more rewarding |I suppose to pick and chose and modify and tweak…but it is NOt more profitable IMO.
I know this is blasphemy to many here. I have traded individual stocks for 20 years now….some incredible gains and some incredible losses too.
The individual stories are often very seductive and it is so tempting to jump on when they start to take off.
Invariably you end up losing as momentum wanes.
To each his own …but I am pumped by this strategy
best
Fully
XGD.TO
OK….I just did some research on my Portfolio and its gains and Losses recently ( since June )
I owned most of Plunger’s Picks and a few others which are highly regarded …with heaviest weighting on
the Royalty Companies.
I bailed on all positions ( 20 of them ) twice during this present run.
A couple of times I hedged with HGD….but that was a mess.
Here is what I found
XGD.TO was equal to or better than 13 of the 20 stocks and worse than 7 of them.
from June 1 to the peak XGD gained a little over 50% and sum total the 20 stocks gained almost exactly 50%.
So….Here is my new strategy.
I will NOT play individual stocks any more !
Blasphemy !
It is MUCH harder to accumulate and tweak and sell 20 individual stocks than to just BUY the XGD.TO etf
And this does not even consider the commissions…which ADD UP !
And…what is NOT to like about XGD
Here it is ….as of Oct 11
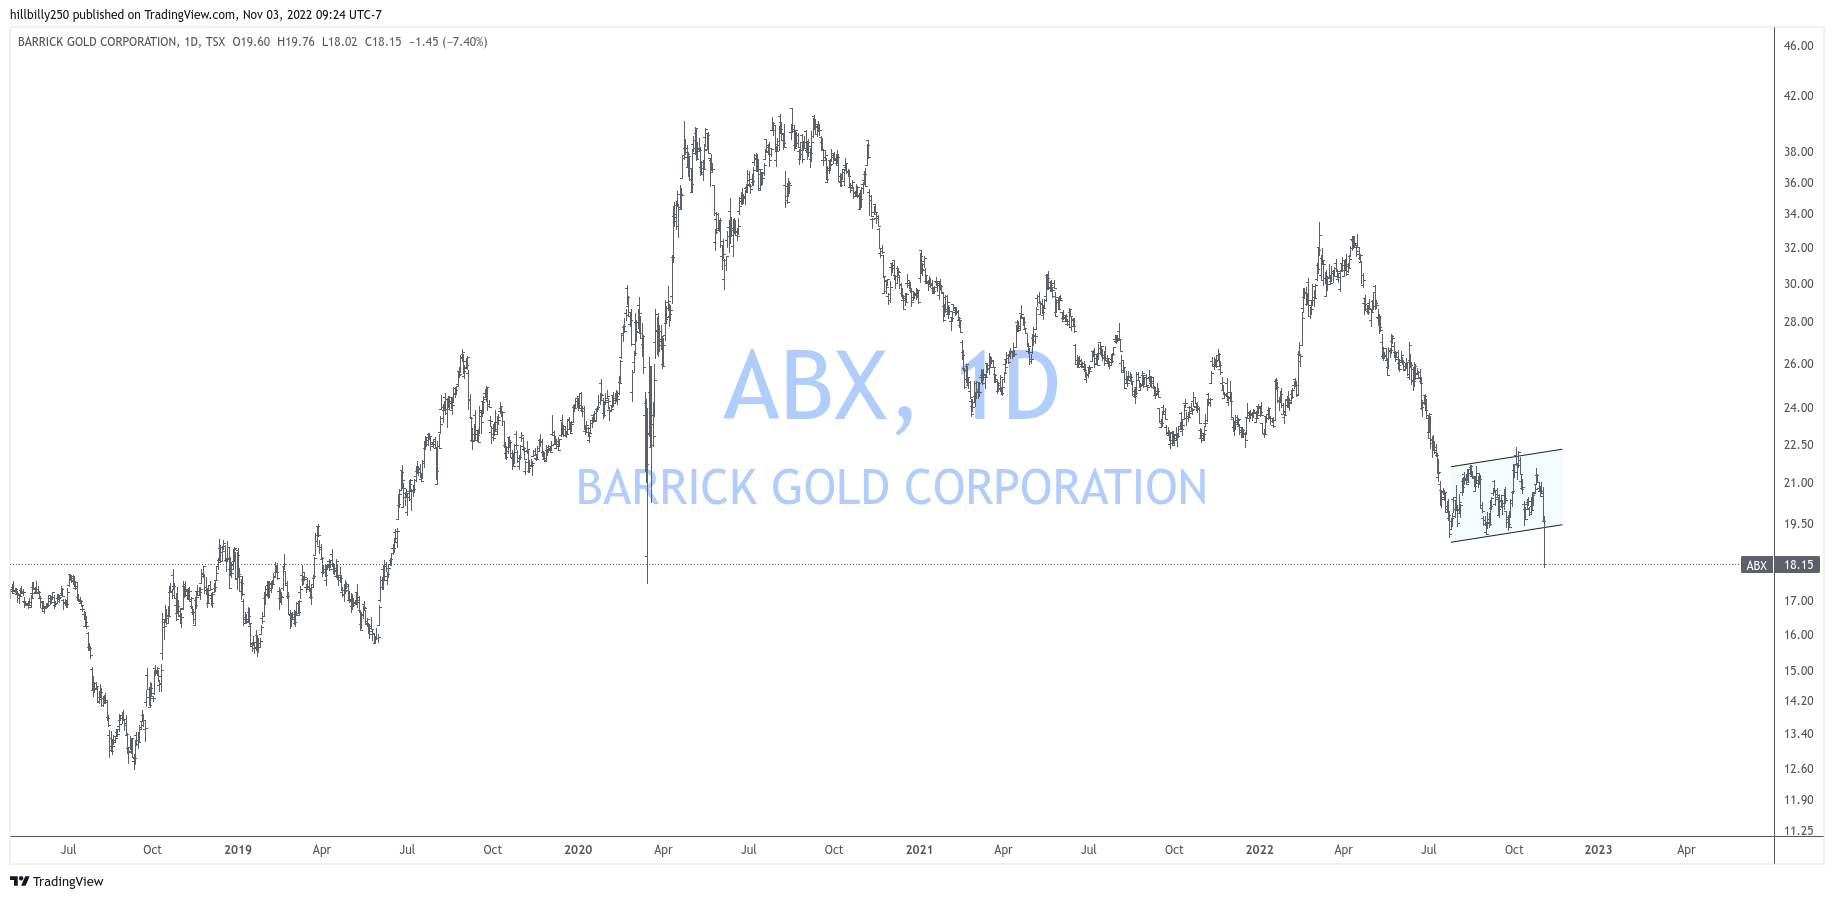
NEM Newmont Goldcorp Corp 18.26% 38.33
ABX.TO Barrick Gold Corp 17.88% 22.49
FNV.TO Franco-Nevada Corp 10.26% 122.17
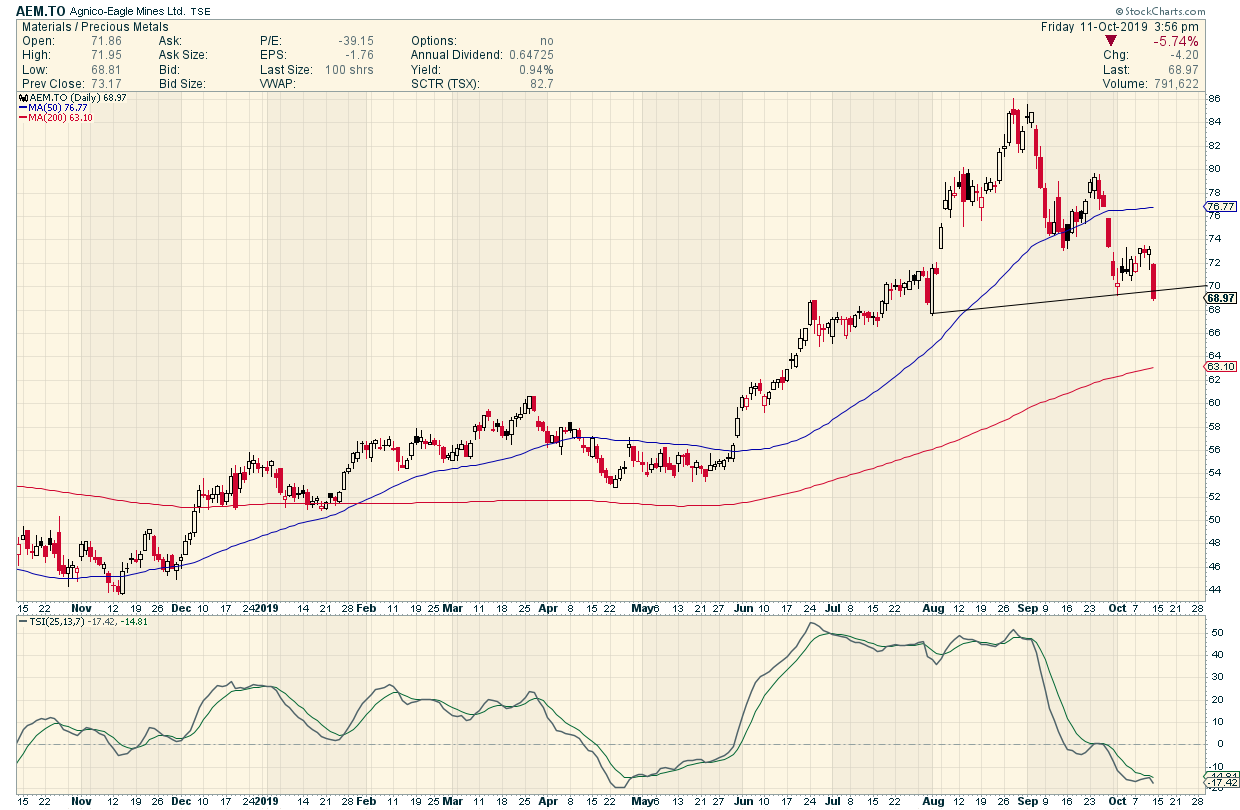
AEM.TO Agnico Eagle Mines Ltd 7.37% 70.44
KL.TO Kirkland Lake Gold Ltd 5.07% 58.76
RGLD Royal Gold Inc.. 4.80% 120.36
AU Anglogold Ashanti Ltd ..4.78% 20.61
K.TO Kinross Gold Corp 3.42% 6.17
GFI Gold Fields Ltd ADR 2.67% 5.58
SBGL Sibanye-Stillwater ADR 1.98% 6.84
BTO.TO B2Gold Corp….. 1.96% 4.27
BVN Buenaventura Mining Co 1.91% 14.50
YRI.TO Yamana Gold Inc. 1.84% 4.42
DGC.TO Detour Gold Corp 1.58% 20.39
AGI.TO Alamos Gold Inc. 1.31% 6.75
PVG.TO Pretium Resources Inc 1.29% 16.18
CG.TO Centerra Gold Inc 1.16% 12.58
SSRM.TO SSR Mining Inc.. 1.03% 19.23
IMG.TO Iamgold Corp…. 0.97% 4.63
OGC.TO OceanaGold Corp. 0.96% 3.17
NG.TO Novagold Resources Inc 0.88% 8.41
EDV.TO Endeavour Mining Corp 0.81% 23.62
HMY Harmony Gold Mining Co 0.80% 3.13
ASR.TO Alacer Gold Corp 0.73% 5.36
OR.TO Osisko Gold Royalties 0.72% 12.39
These without exception are ALL great PM Stocks.
Whoever picked them deserves congratulations
It’s as if they were a member of the Rambus/Goldtent Community.
So From now on…NO MORE anguishing over portfolio choices and tweaking
I will just buy XGD.TO ….
Then sell some if we see an obvious resistance …add some back at support…..etc and so forth
AND if I’m feeling Bold there is a 2X Leveraged ETF HGU.TO which is based on XGD
Or for hedging I could put on some HGD ( 2X short XGD)
I guess I am a slow learner…BUT This strategy makes so much sense to me
For those who don’t like the 35% top heavy exposure to Barrick and Newmont
There is another Canadian ETF with smaller companies dominating ZJG
Note this is very thinly traded ( hardly trades at all for some reason) BUT the market makers do a great job of keeping spreads low and the trades are always fair and gains very well co related to the stocks in it
Here it is. Another great looking Group of Miners…Worthy of your portfolio replacement .
I rest my case
BTO.TO B2Gold Corp…… 9.10% 4.27
YRI.TO Yamana Gold Inc. 8.32% 4.42
DGC.TO Detour Gold Corporation 7.16% 20.39
AGI.TO Alamos Gold Inc. 6.26% 6.75
PVG.TO Pretium Resources Inc 5.87% 16.18
CG.TO Centerra Gold Inc 5.02% 12.58
SSRM.TO SSR Mining Inc.. 4.86% 19.23
OGC.TO OceanaGold Corp. 4.49% 3.17
IMG.TO Iamgold Corp…. 4.41% 4.63
EDV.TO Endeavour Mining Corp 4.00% 23.62
NG.TO Novagold Resources Inc 4.00% 8.41
OR.TO Osisko Gold Royalties ..3.41% 12.39
ELD.TO Eldorado Gold… 3.39% 10.33
ASR.TO Alacer Gold Corp 3.28% 5.36
SMF.TO Semafo Inc…… 2.96% 4.16
CDE Coeur Mining Inc 2.95% 4.81
TXG.TO Torex Gold Resources …2.92% 16.74
SSL.TO Sandstorm Gold Ltd 2.77% 7.70
NGD.TO New Gold Inc…. 1.86% 1.31
SA Seabridge Gold Inc 1.73% 12.47
WDO.TO Wesdome Gold Mines Ltd 1.70% 6.59
DPM.TO Dundee Precious Metals 1.32% 4.51
MUX McEwen Mining Inc 1.22% 1.56
CNL.TO Continental Gold Ltd 1.14% 4.06
TGZ.TO Teranga Gold Corp 0.84% 5.15
As of Sept. 30, 2019
“Any intelligent fool can make things bigger and more complex … it takes a touch of genius — and a lot of courage — to move in the opposite direction.”
Albert Einstein
Some want to sugar coat today’s move.
But it is horrific
It is the opposite of yesterdays move and then some.
Yesterday Gold and Silver were Down pretty hard and the PM Shares treaded Water
Today Gold and Silver are OK but the Shares are Drowning !
Many Quality Miners are Down 5% 7% 10% and more
Breakdowns all over the sector !
Just a few

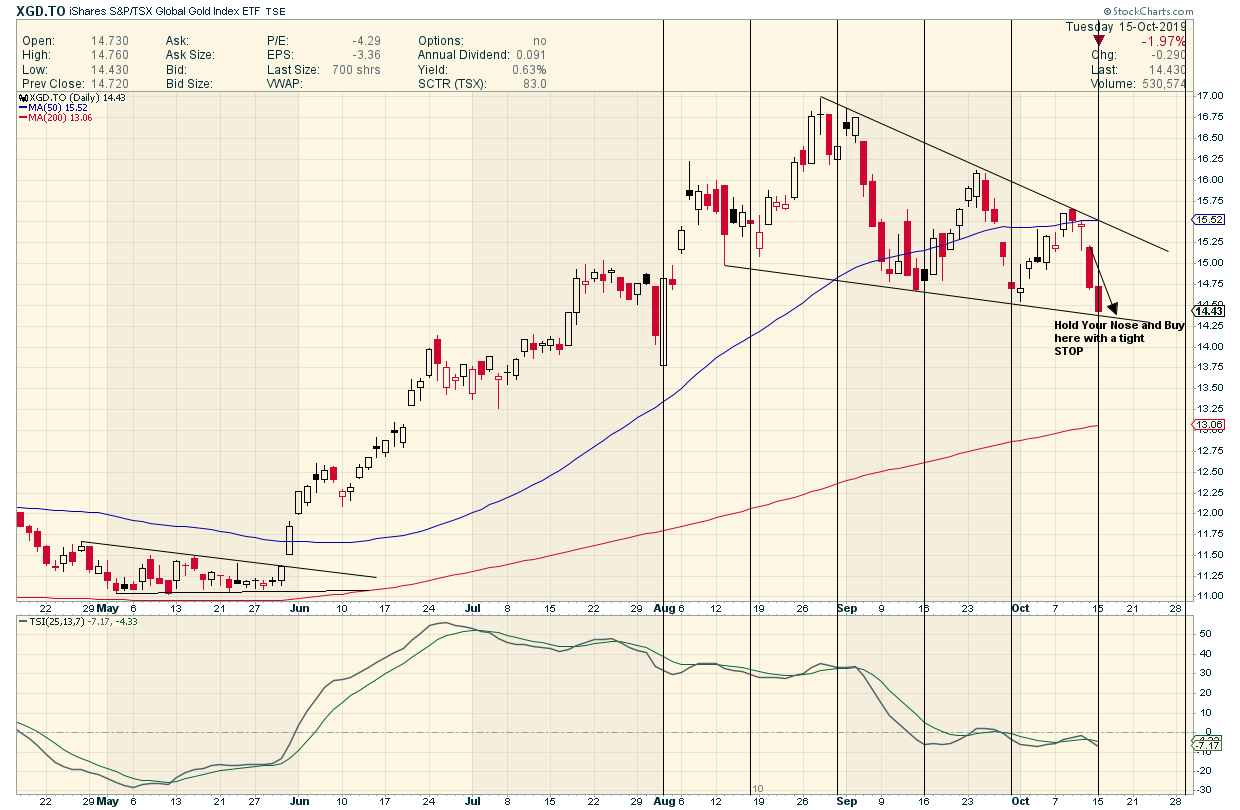
Having said that…Here’s a Plan
IF that bottom line goes …RUN Forrest Run !
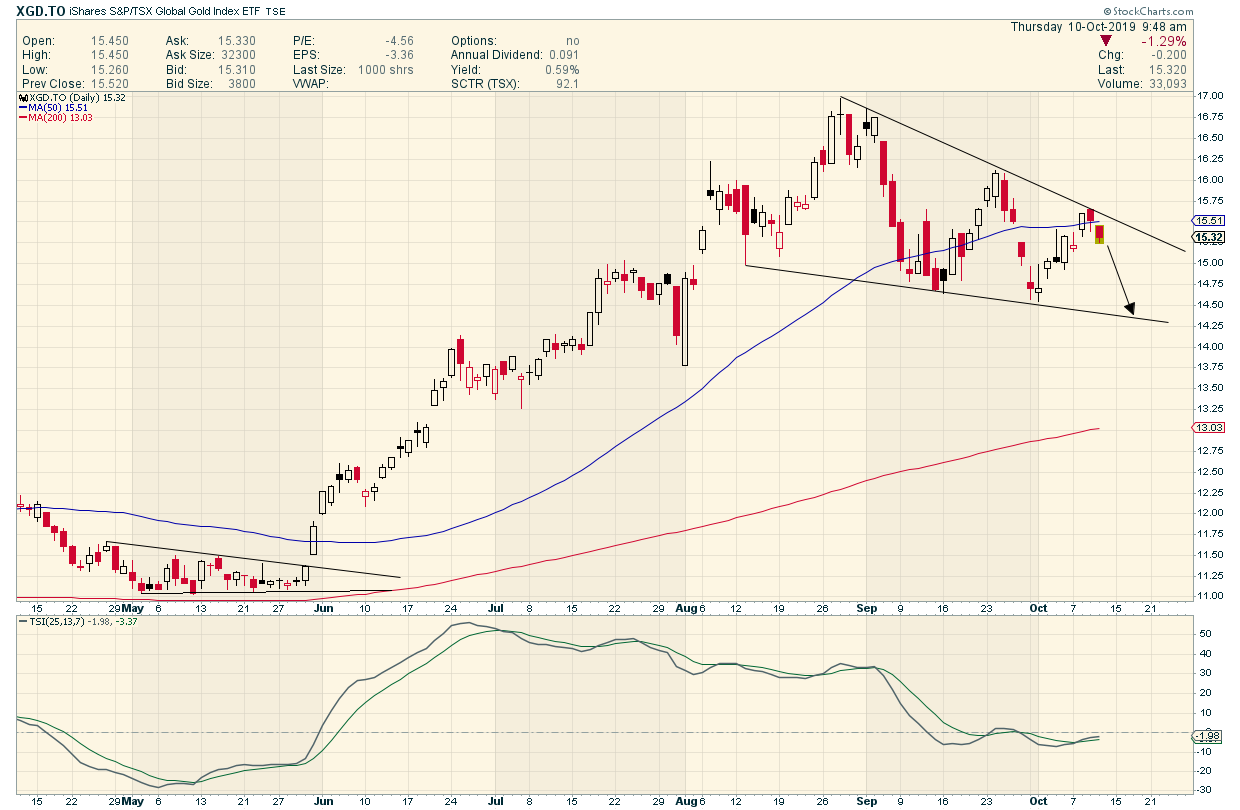
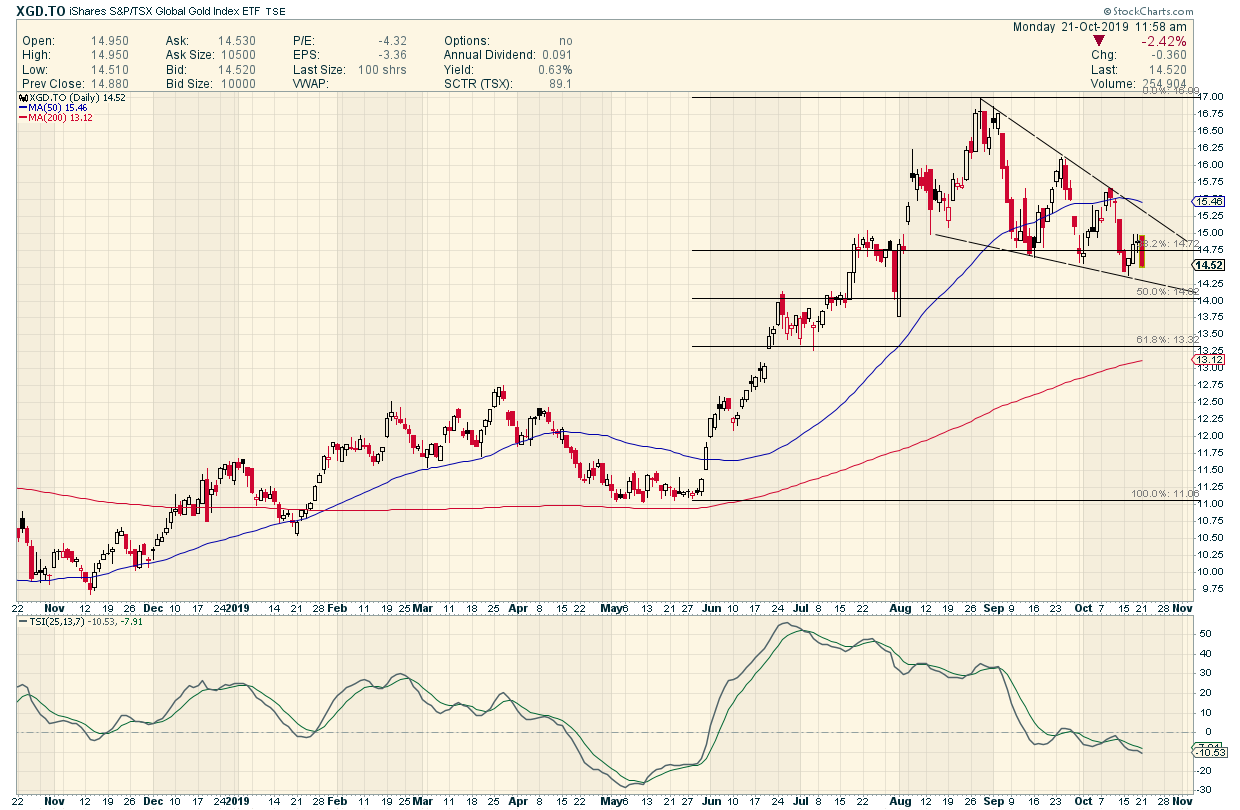
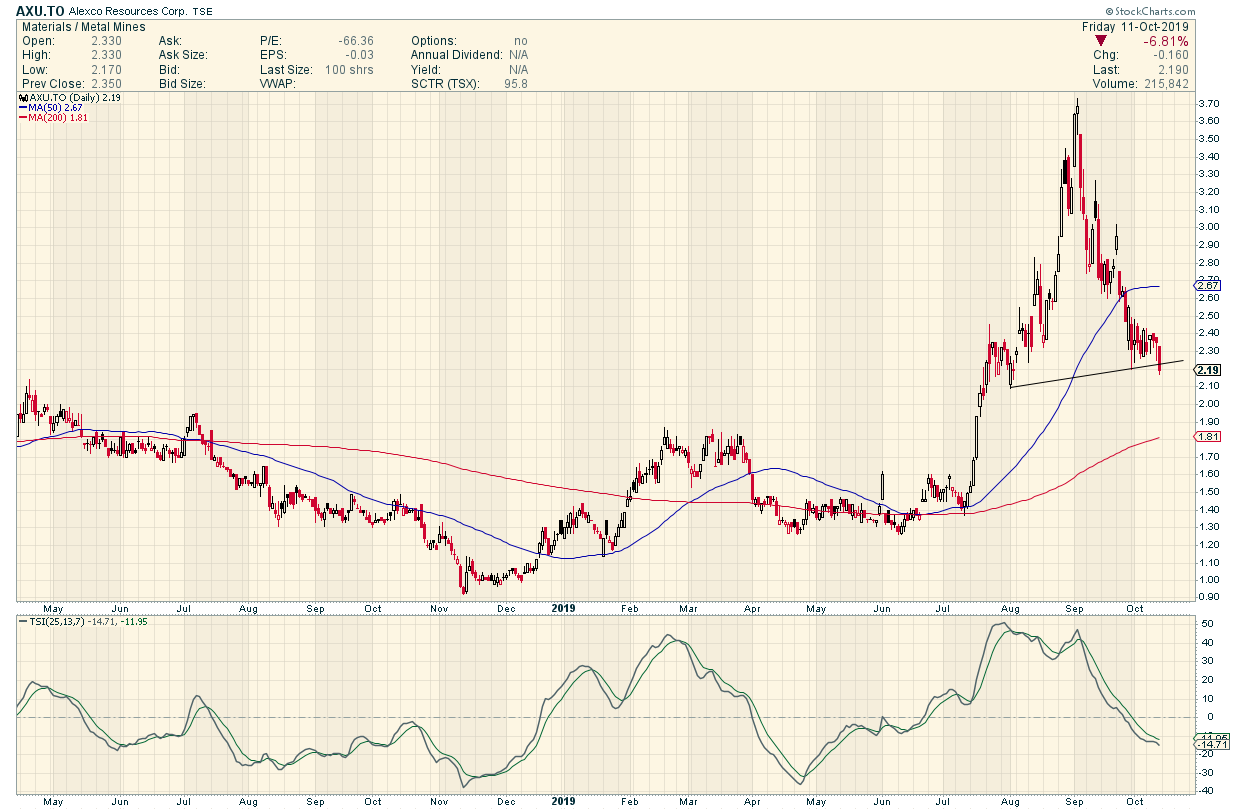
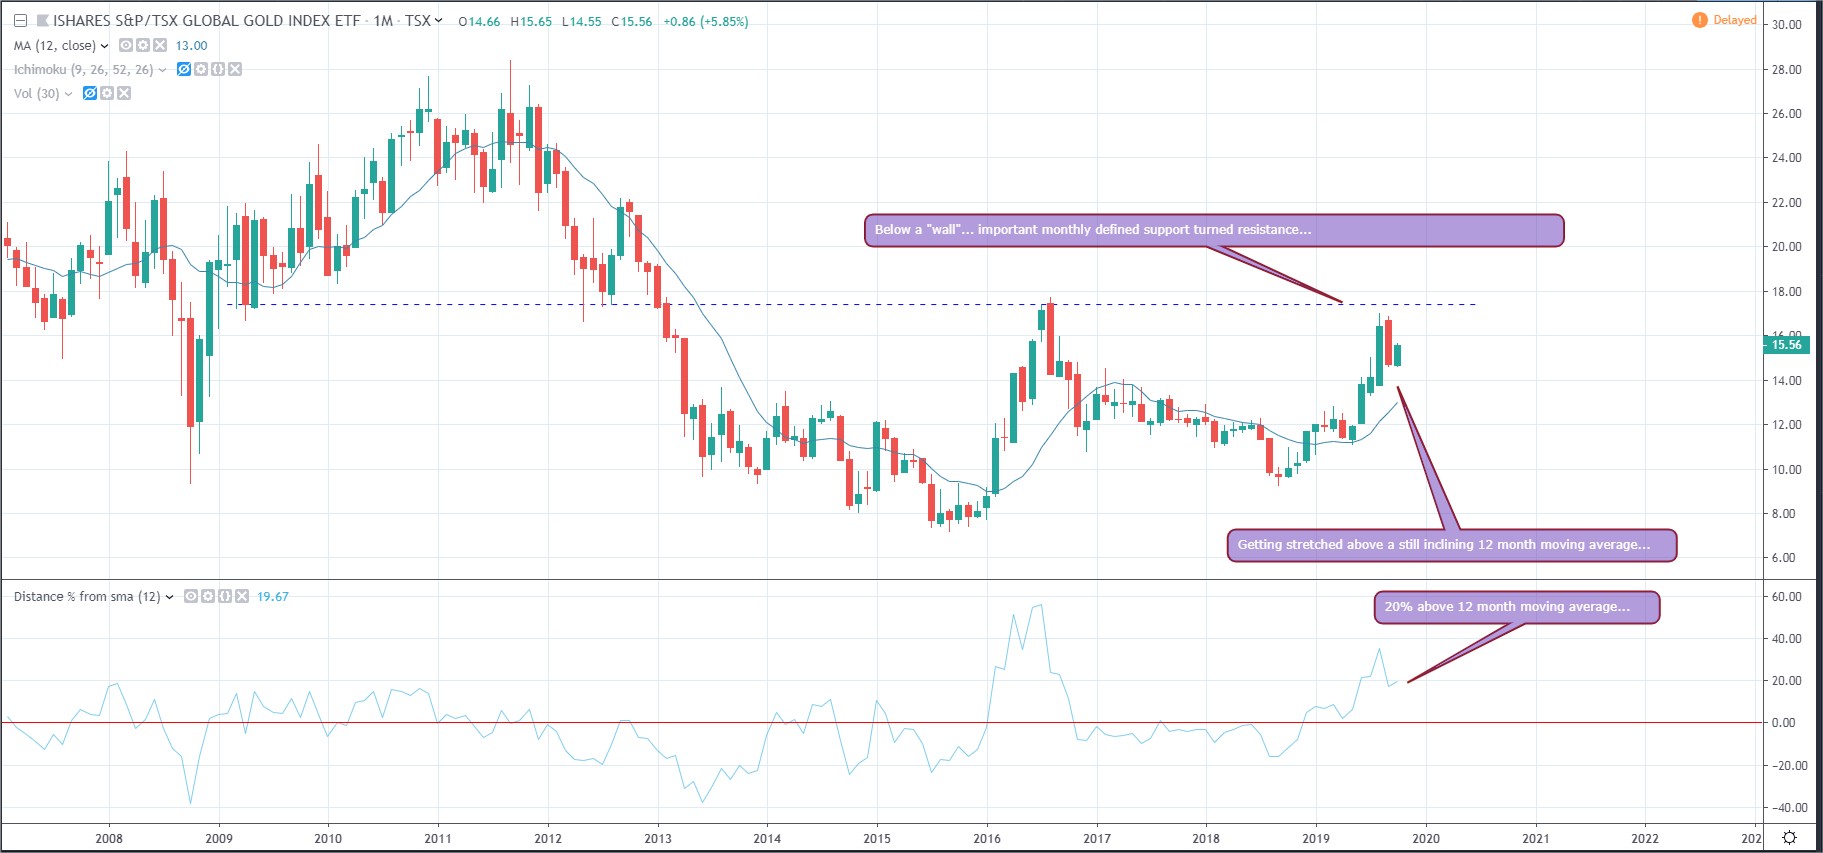
Here is my take on xgd.to
I would not enter at this level, seems to be in “no-man’s land”. Better risk:reward entry when price action gets closer to 12 month moving average… or a monthly close above the horizontal breakout line. We are however making higher lows… soo this smells good.. just need patience…
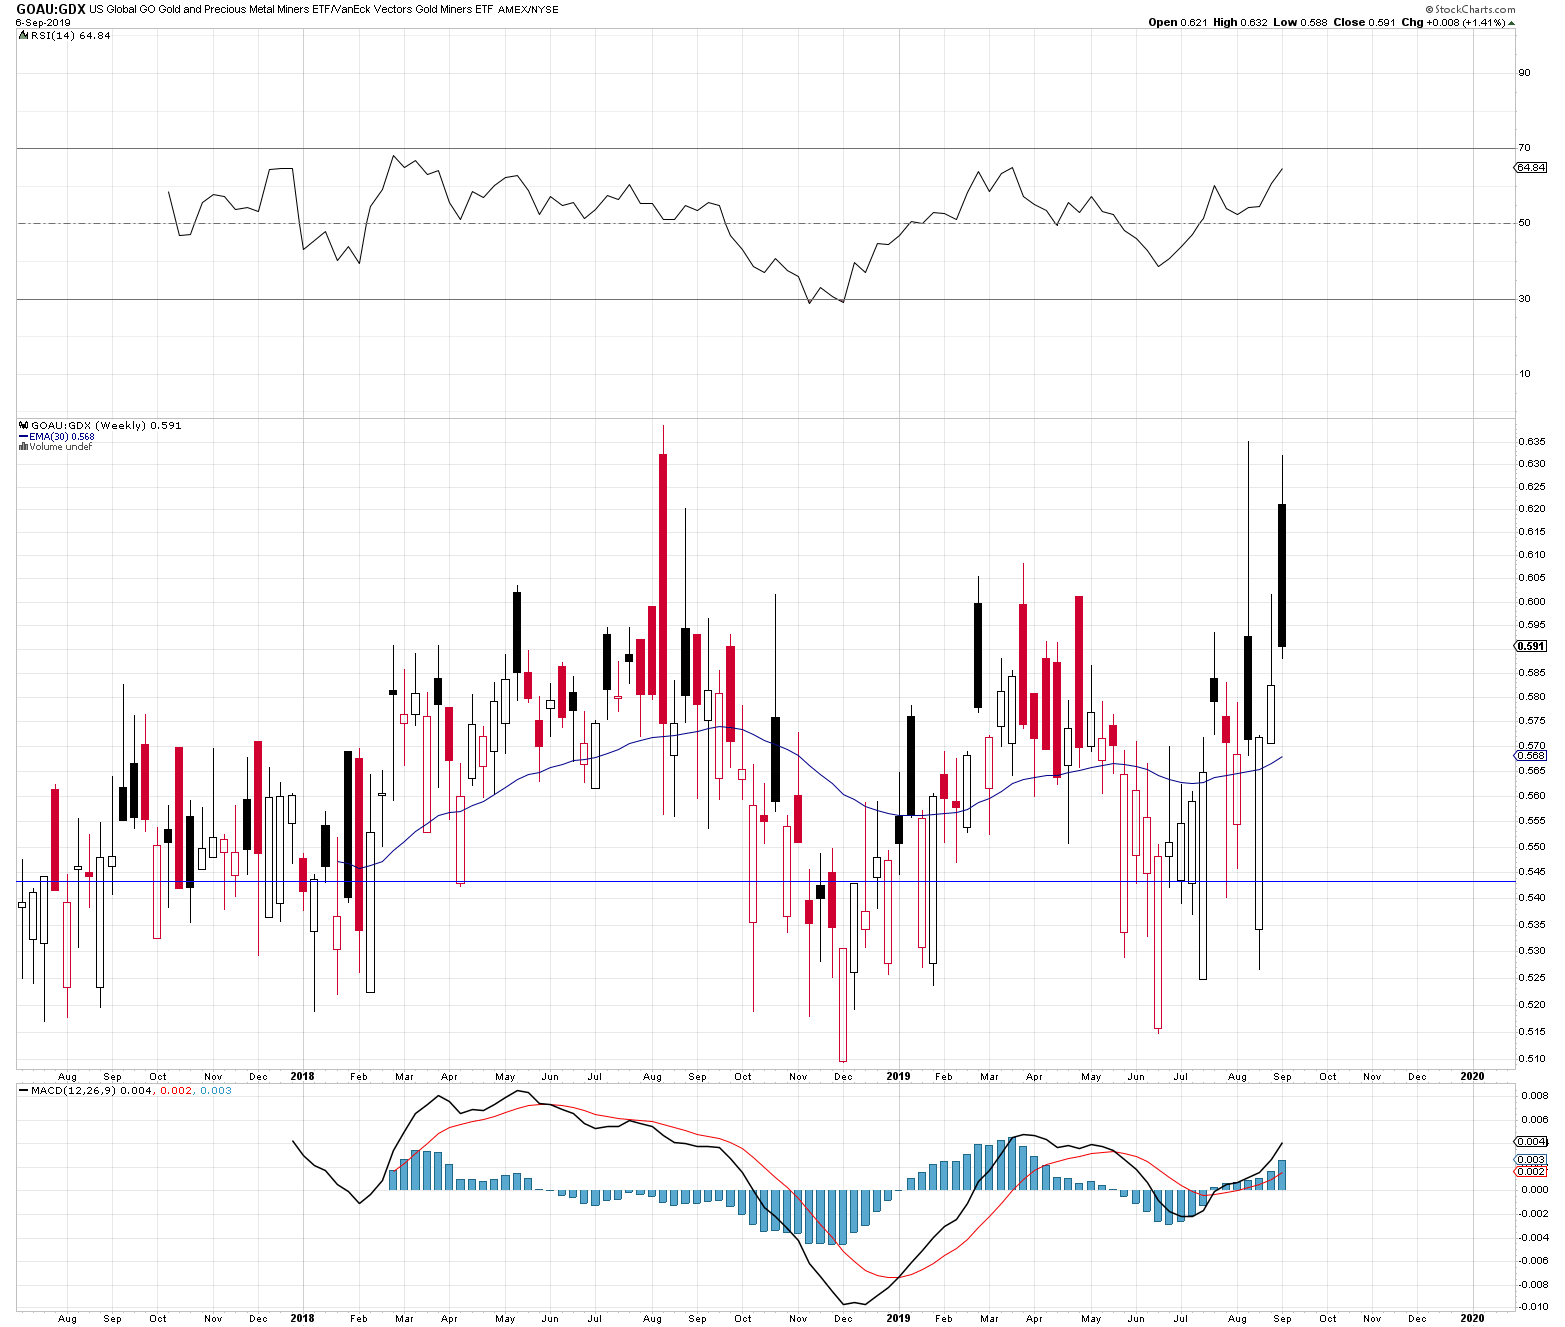
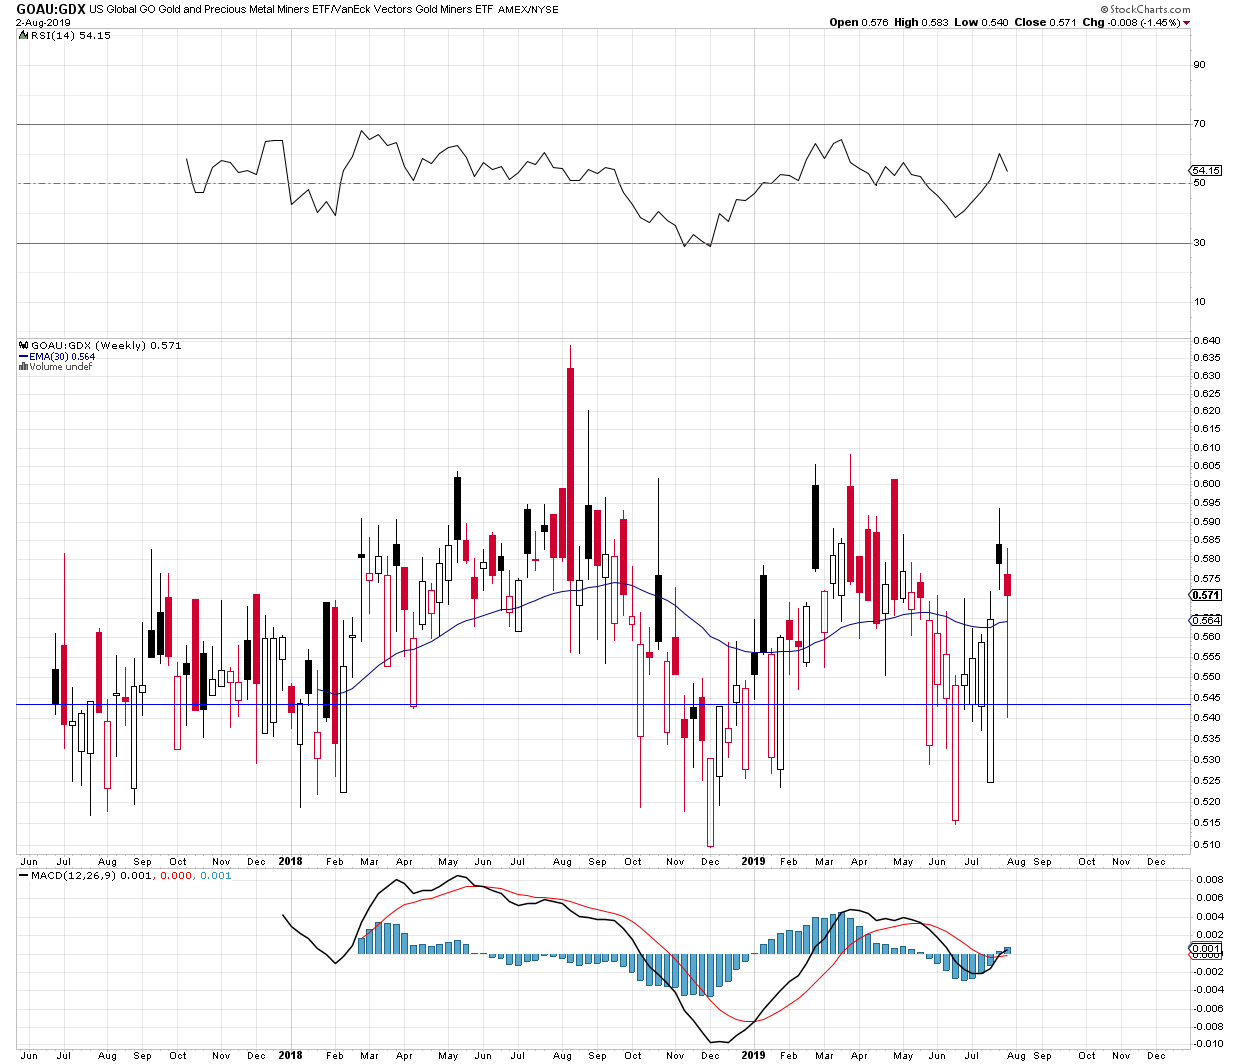
How does the upstart GO Gold compare with the competition this past pullback week? Pretty good, actually.
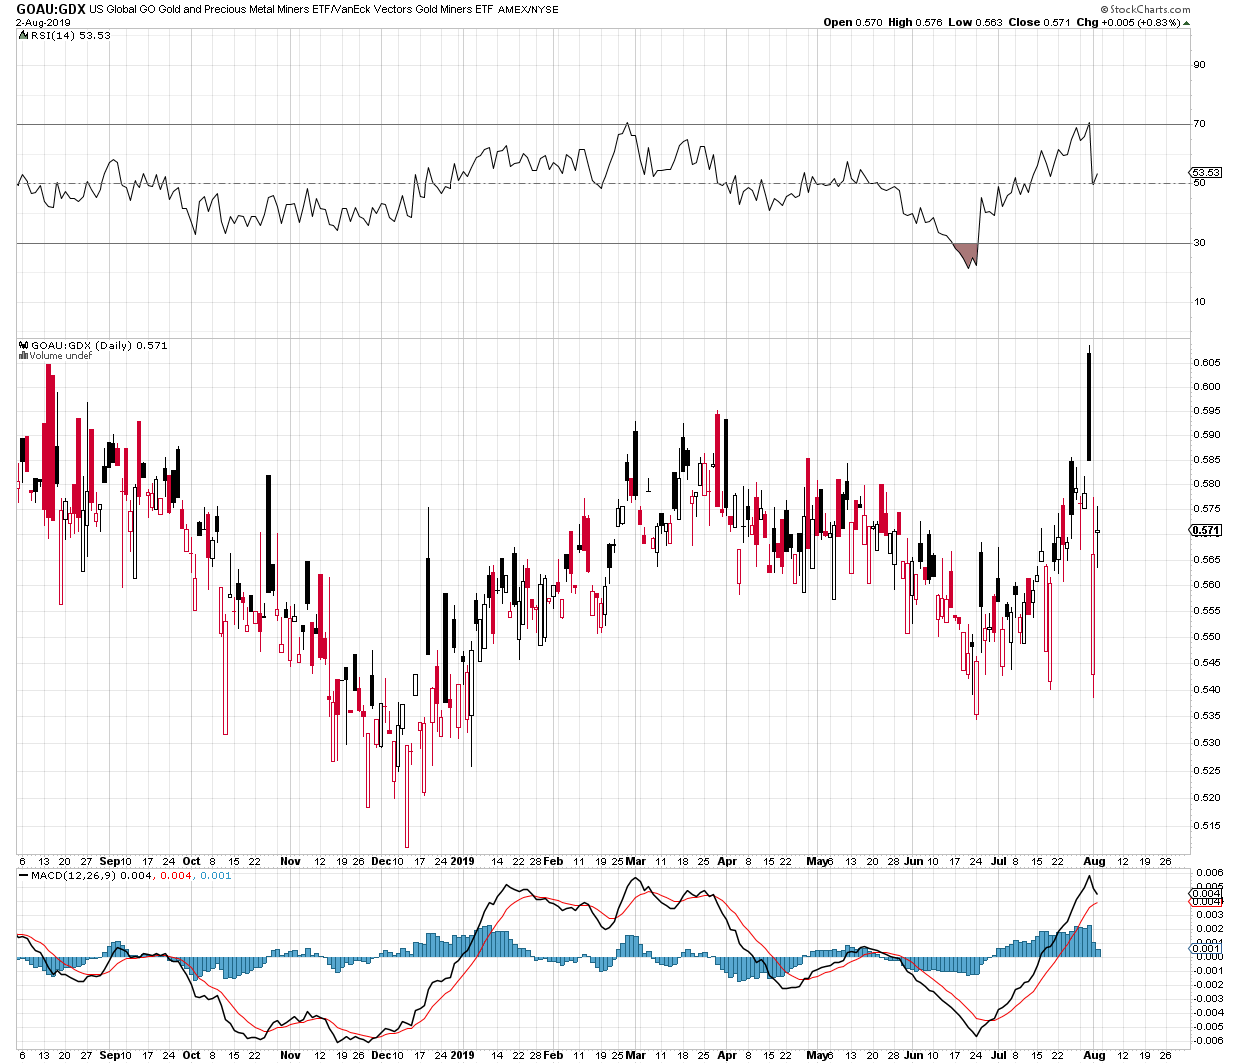
GOAU:GDX
GOAU:GDXJ
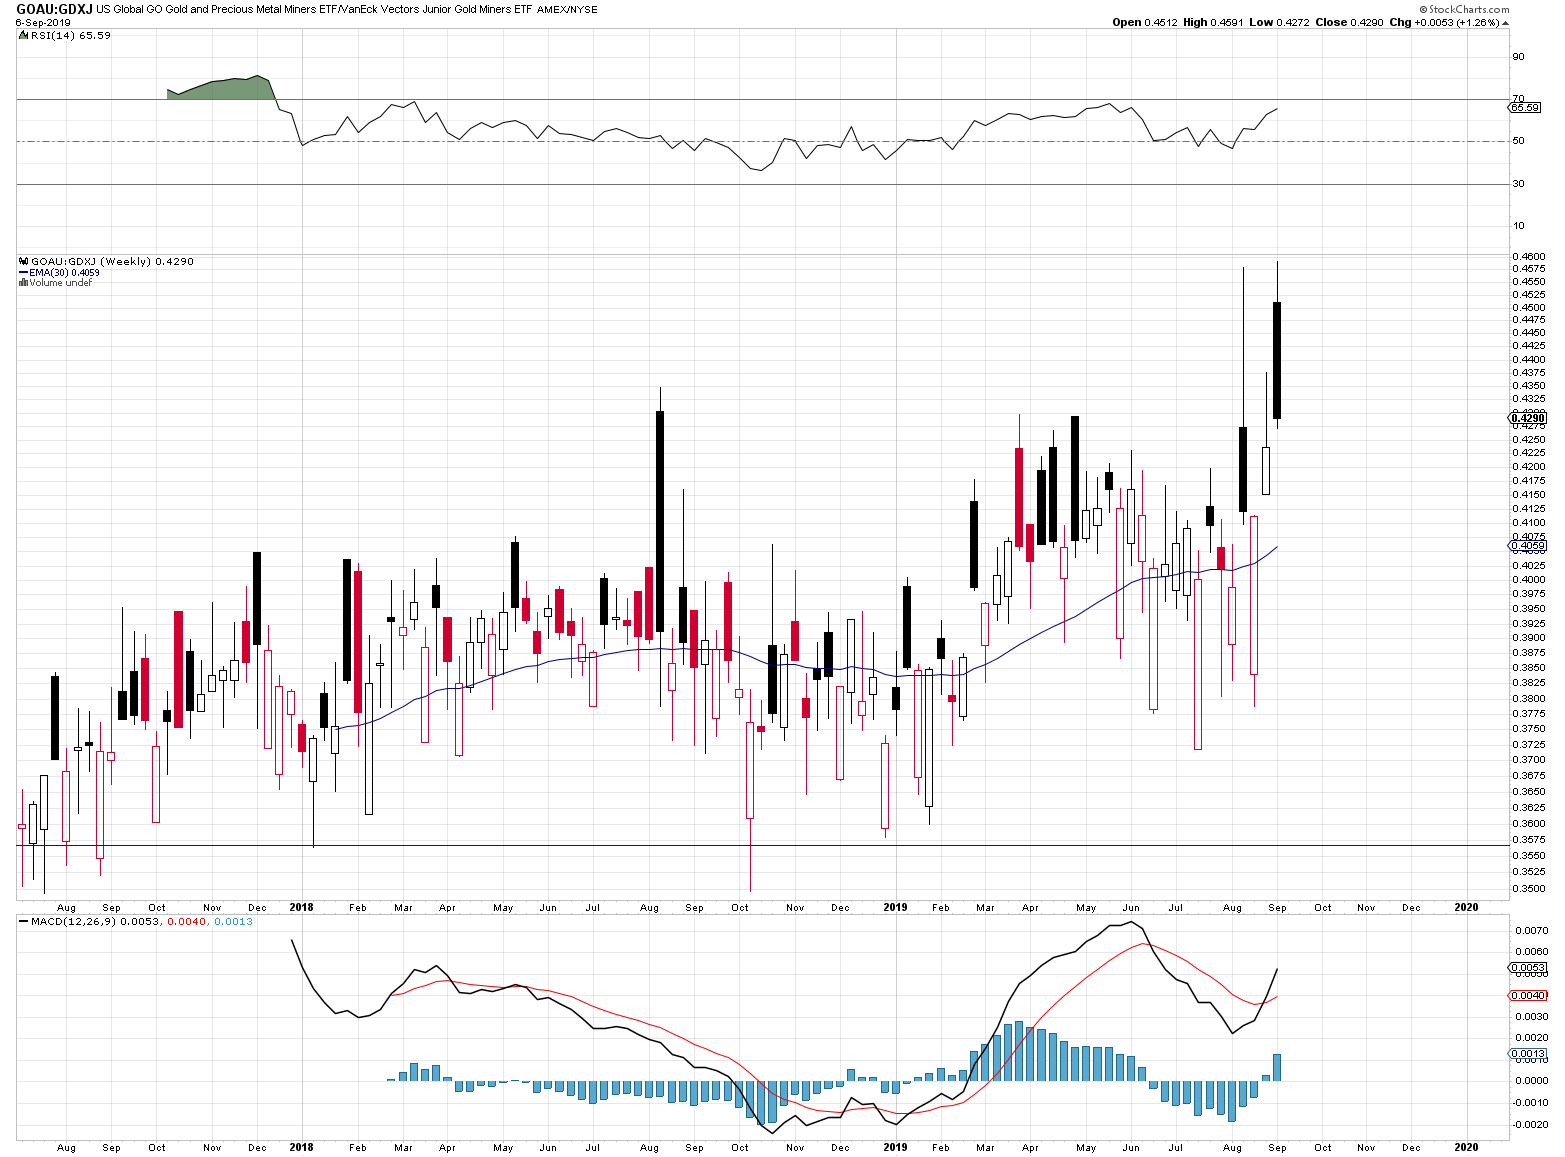
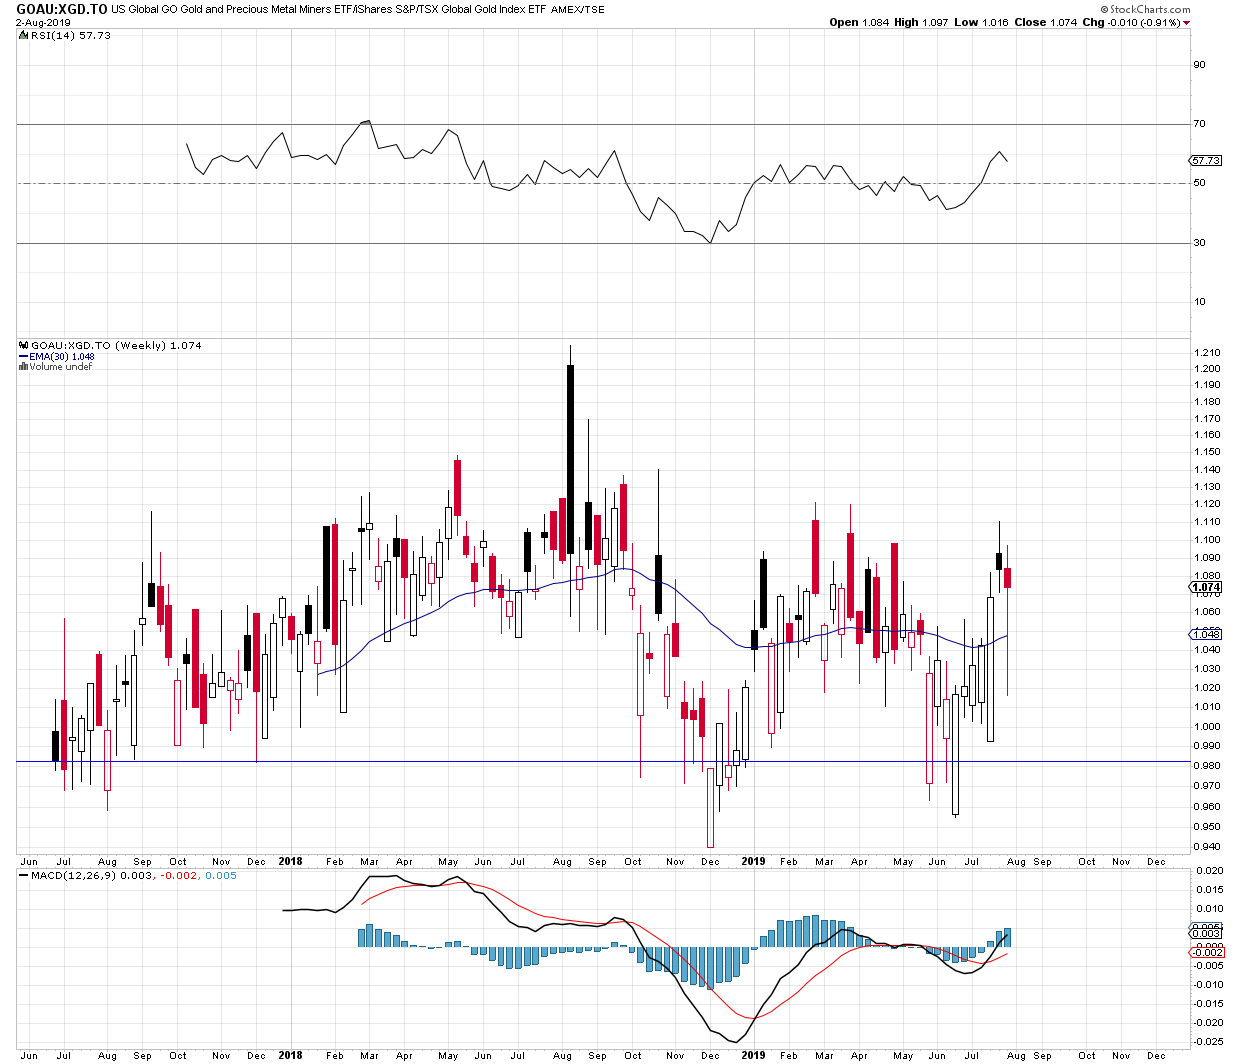
GOAU:XGD

GO Gold is the the leader, clearly.
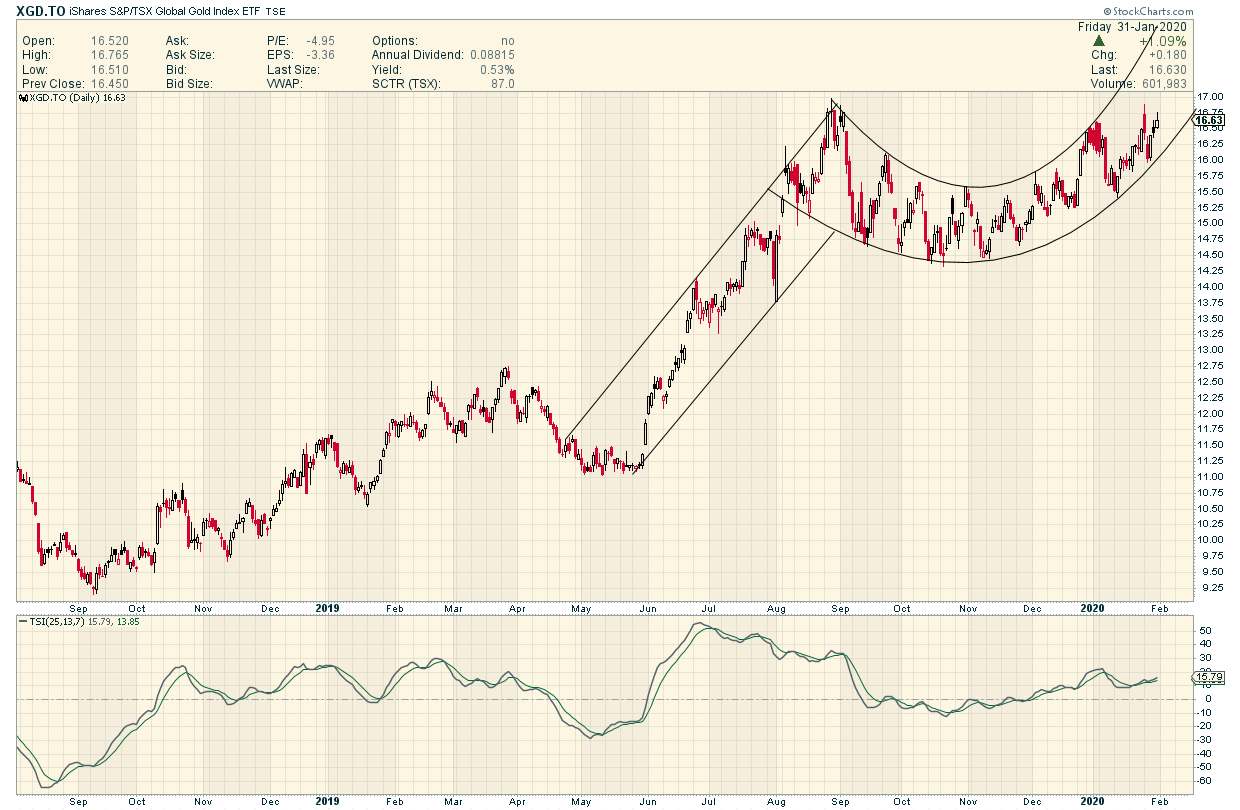
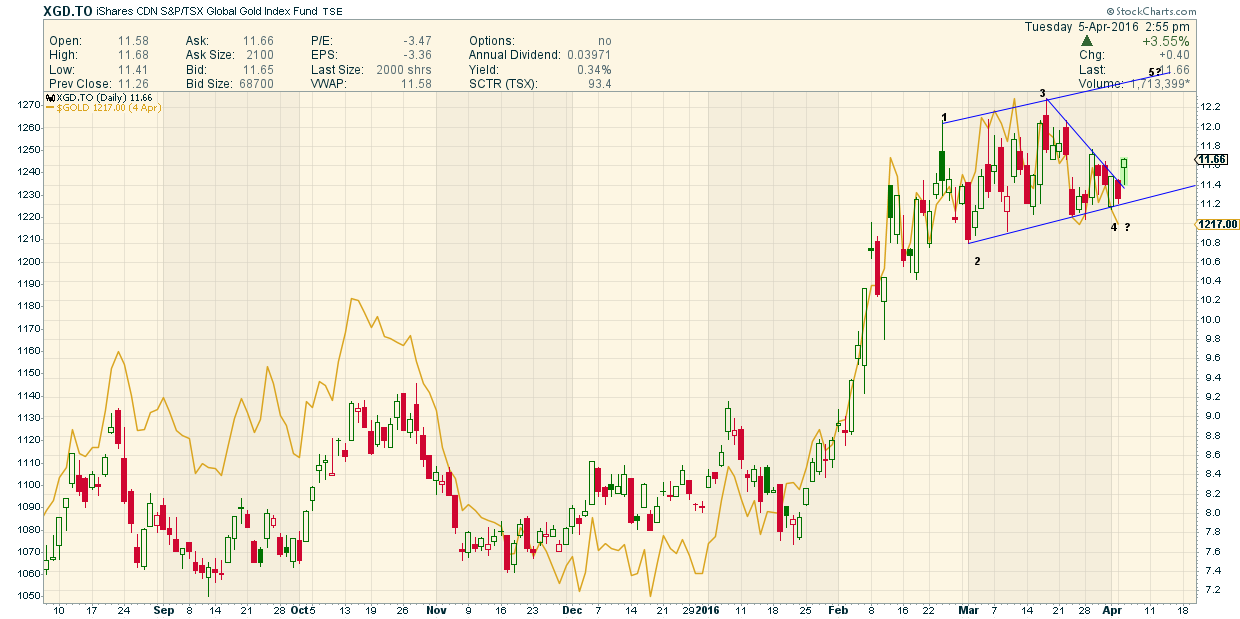
I like to compare this move in Gold Stocks ( Basis XGD.TO )
To the 2016 blast
Looks like …if the moves rhyme…we are now half way there.
Have a look XGD peaked on a closing basis after 24 weeks
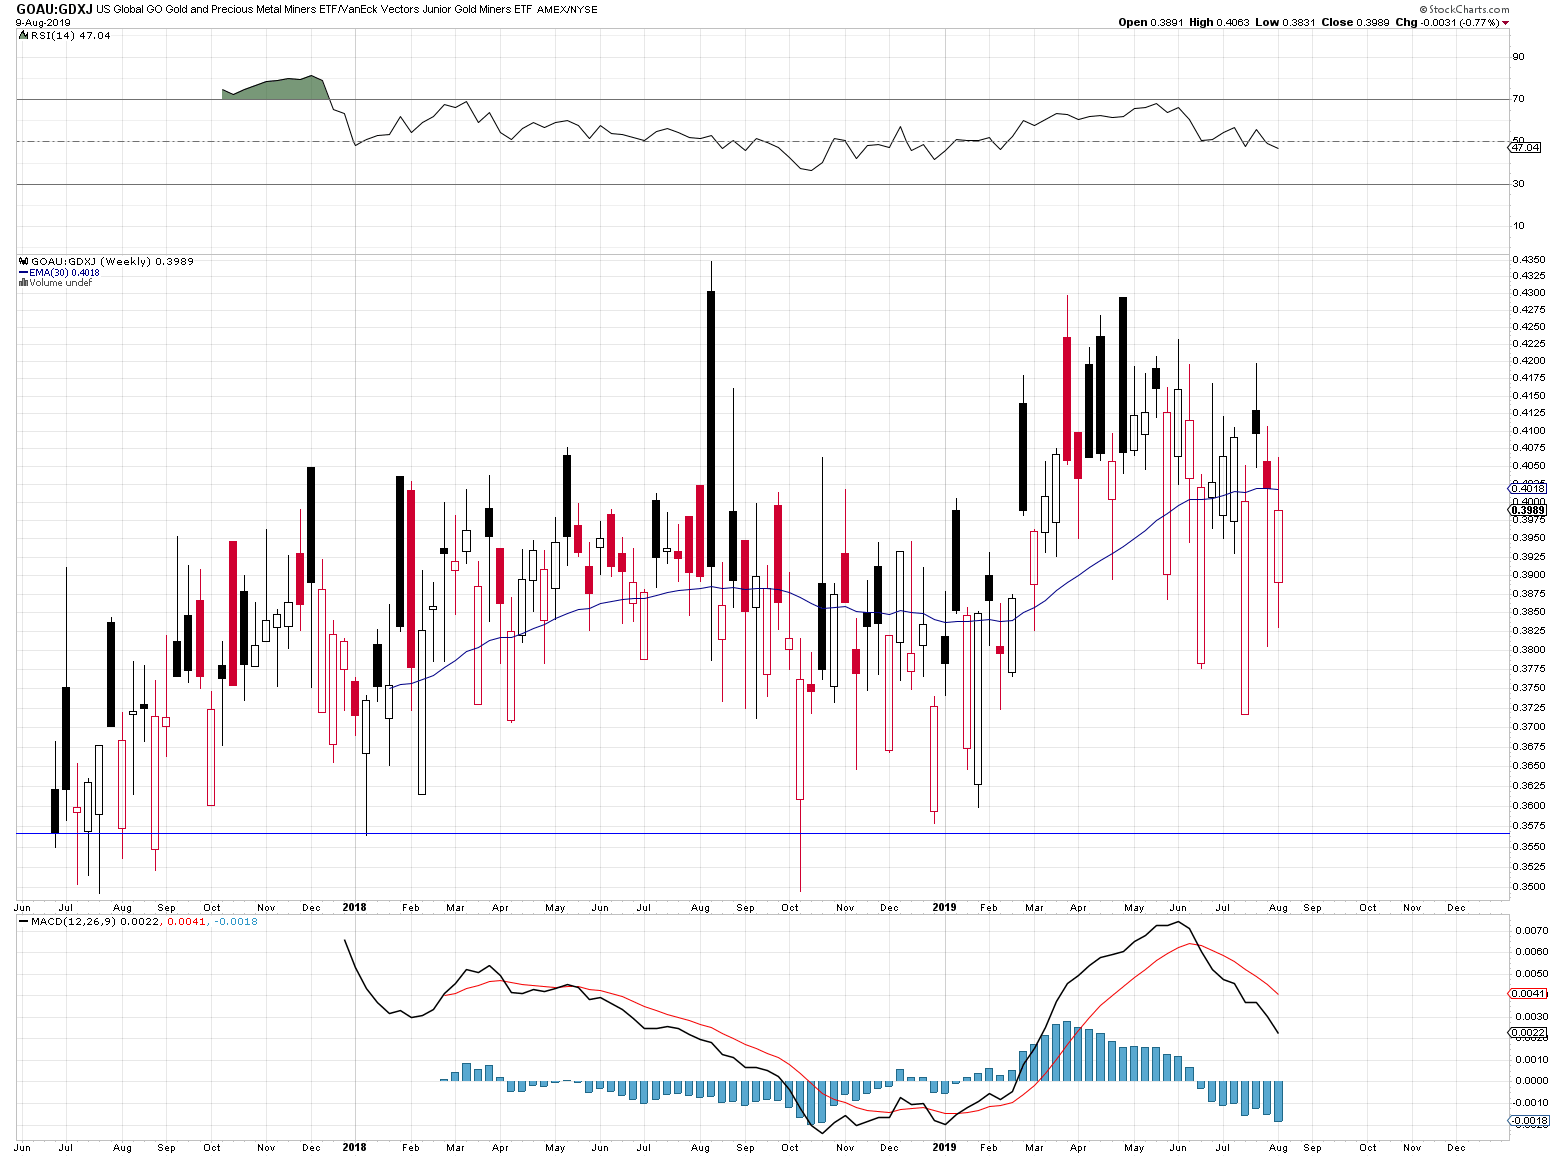
How did the New kid on the block, Go Gold, (GOAU) compare with GDX, GDXJ, and XGD this week?
They are all very close, but GOAU lost a little bit against each of the other three ETFs. Still ahead though. The blue trend line marks the GOAU: ratio close after the first week of trading.
GOAU:GDX
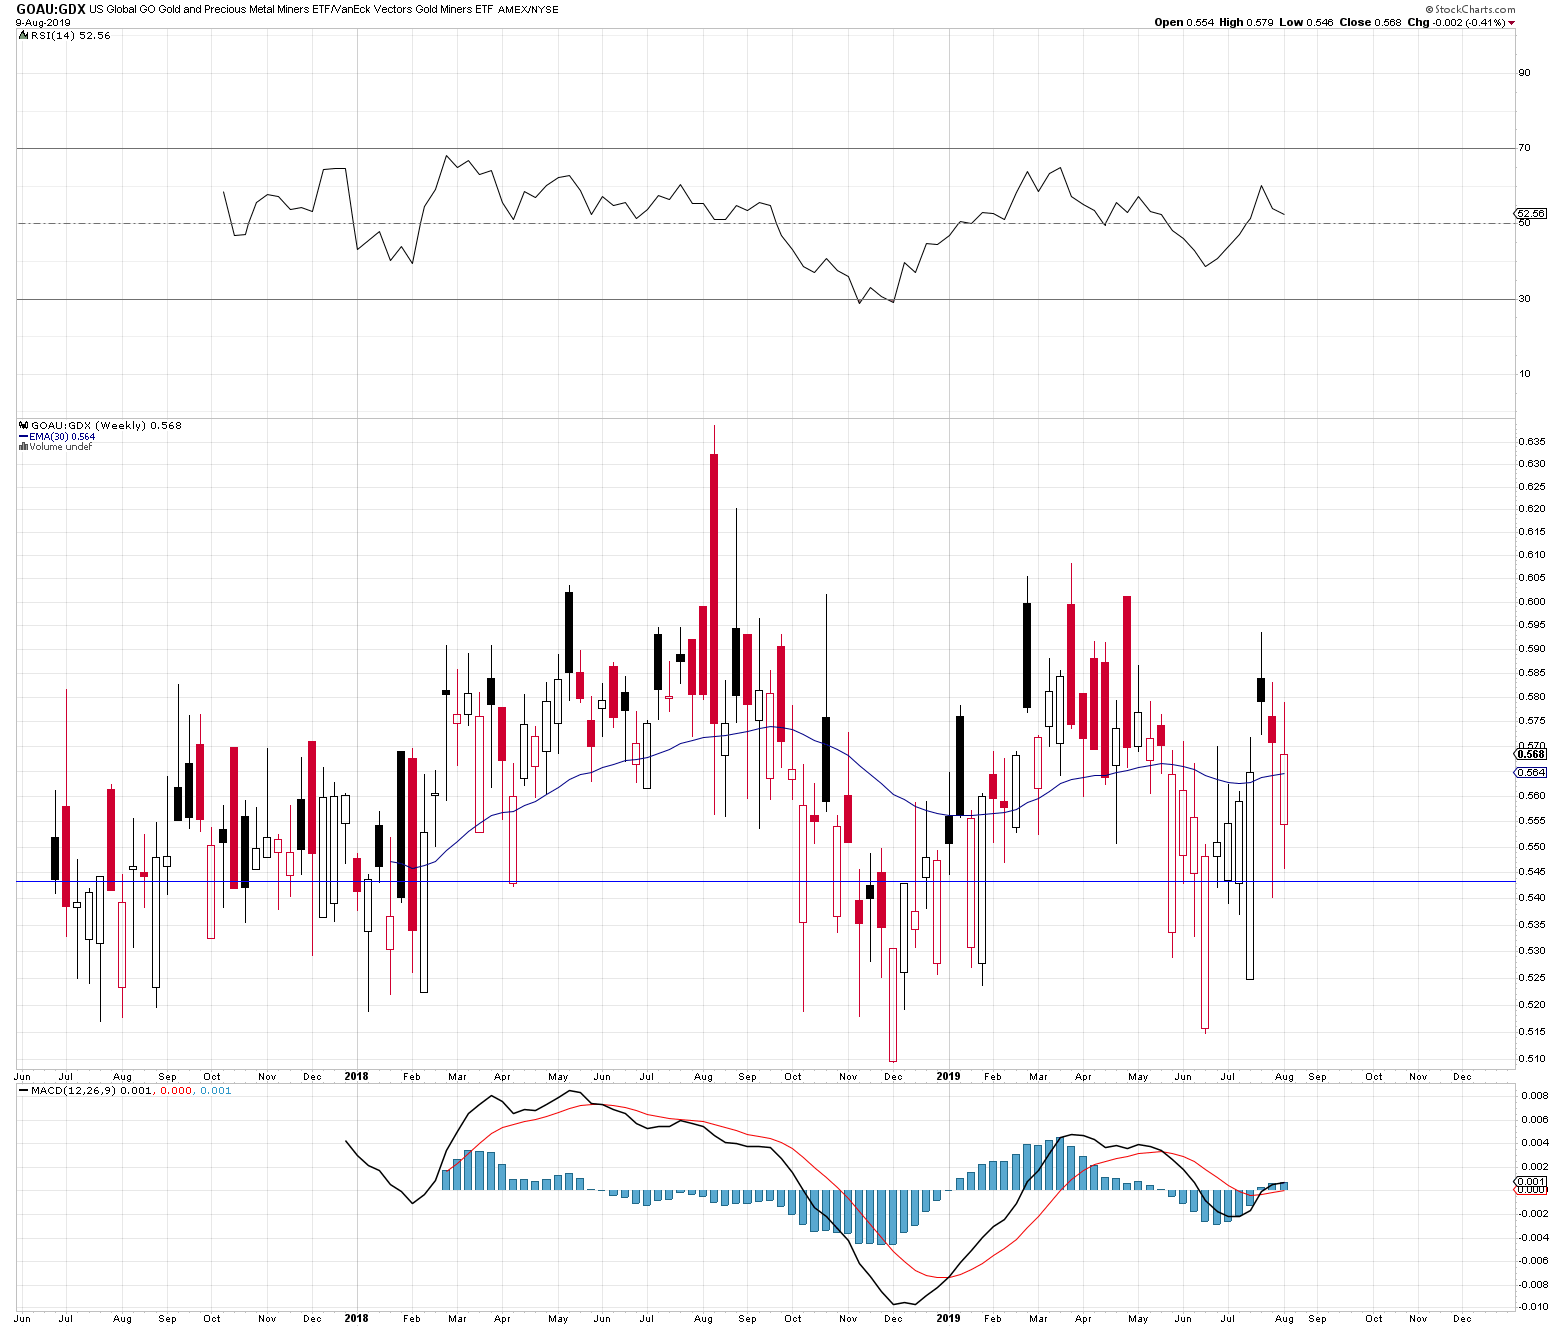
GOAU:GDXJ
GOAU:XGD
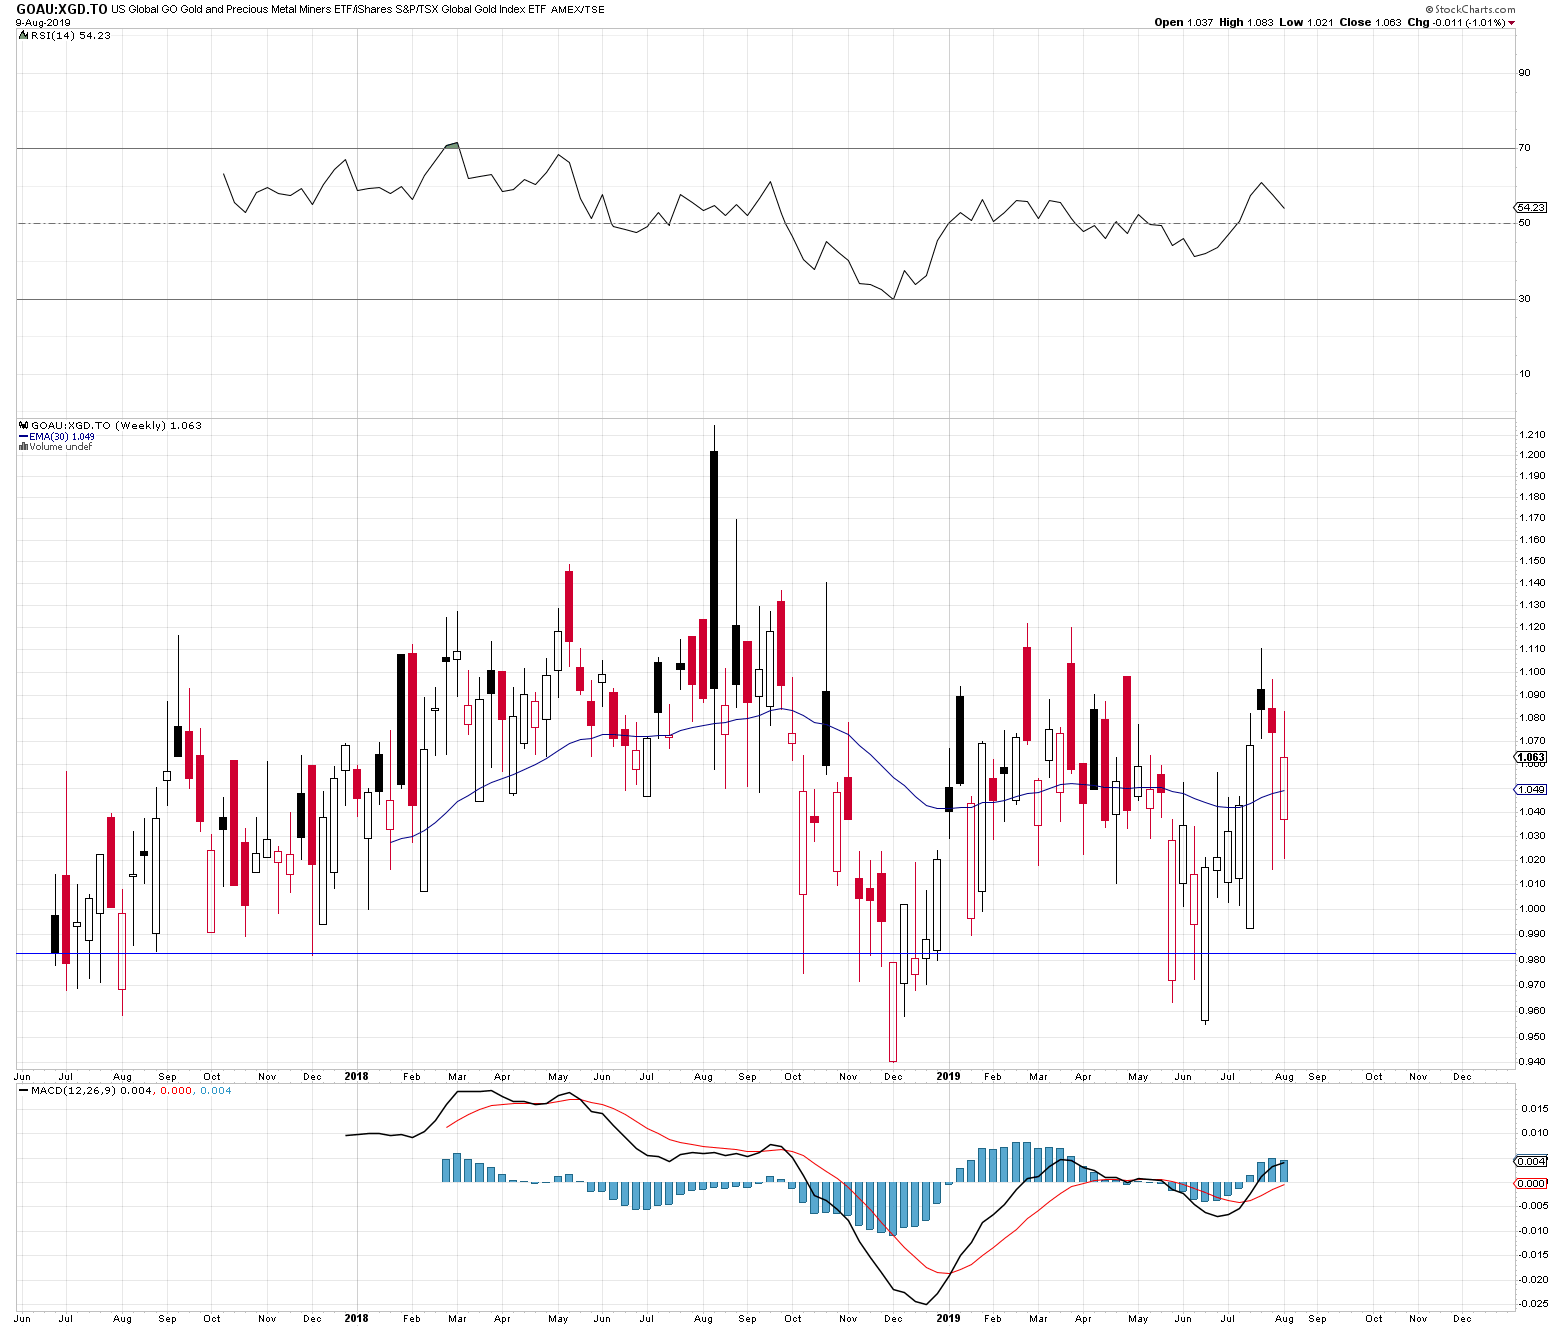
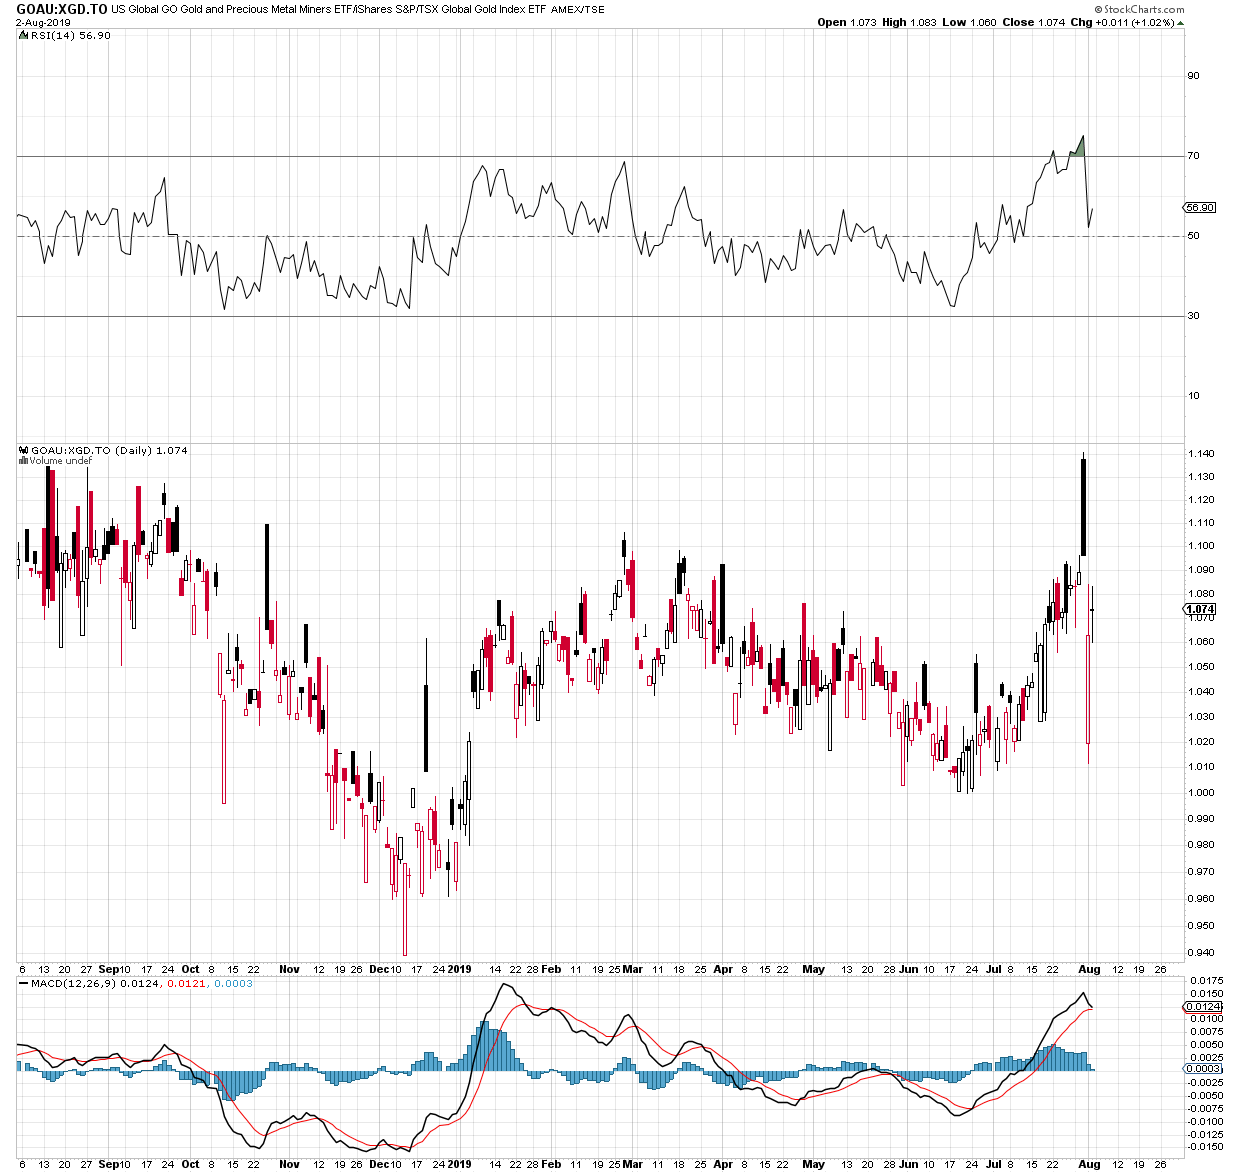
Am posting the daily and the weekly charts today.
GOAU:XGD Daily
GOAU:XGD Weekly
GOAU:GDX Daily
GOAU:GDX Weekly
GOAU:GDXJ – Daily
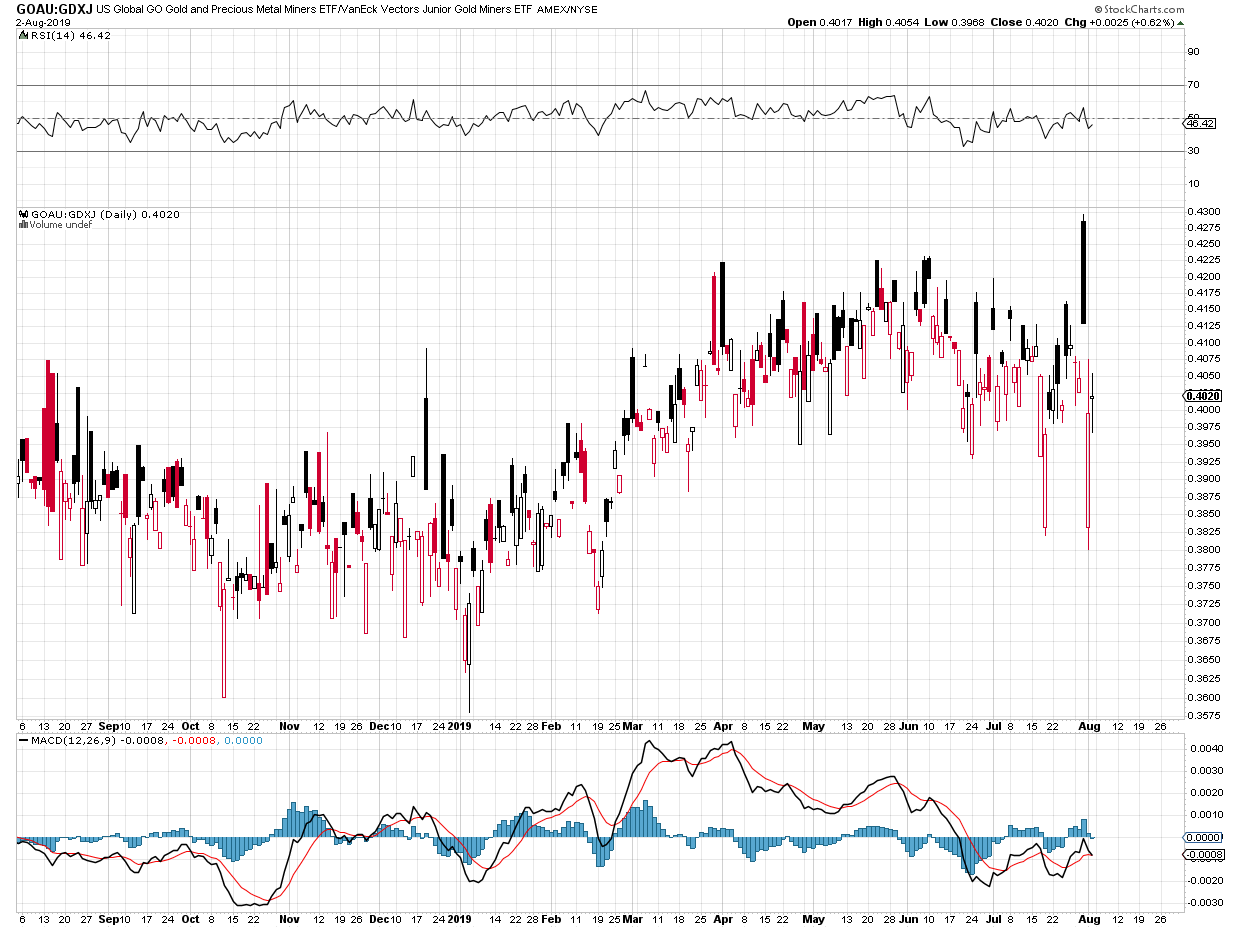
GOAU:GDXJ – Weekly
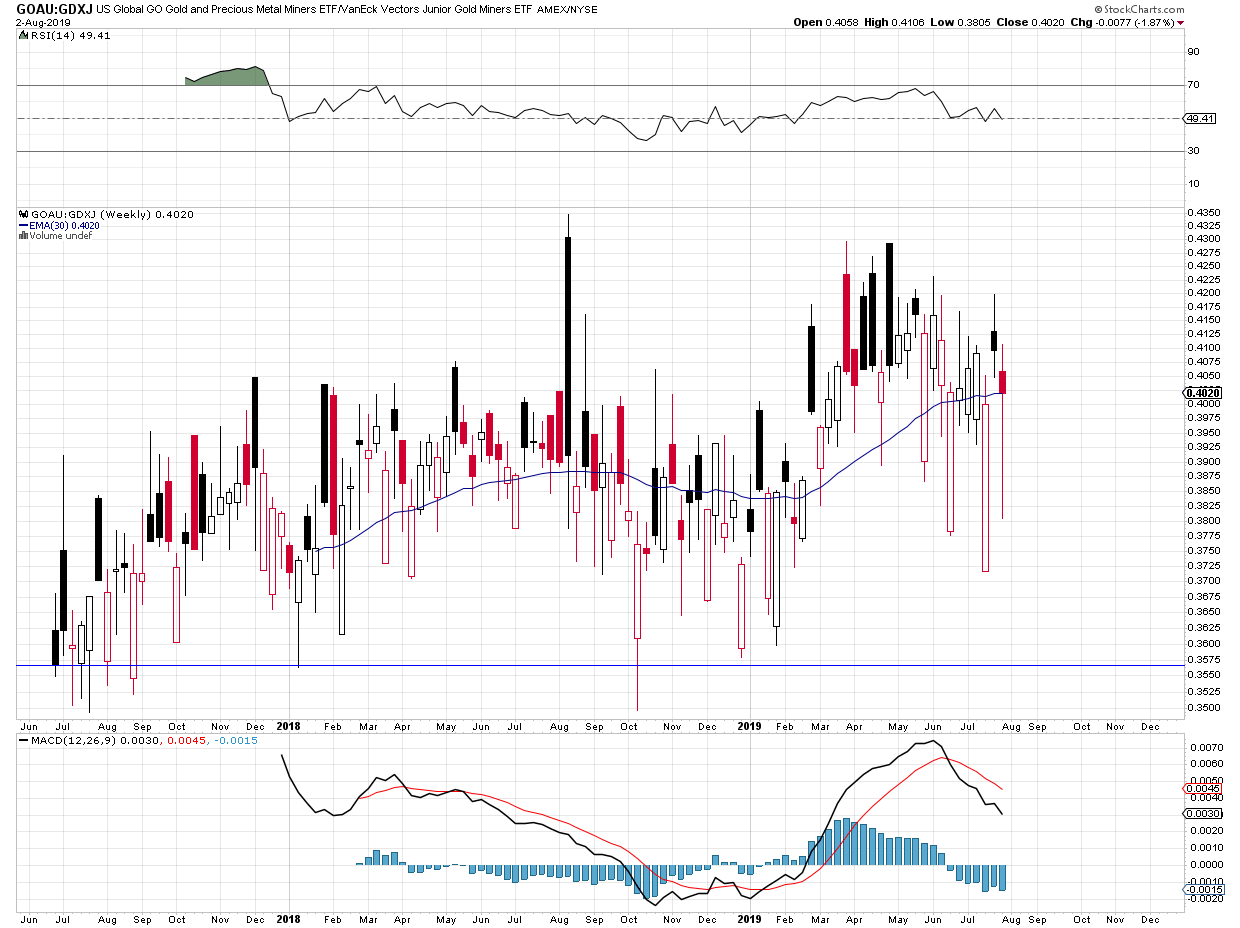
Go Gold lost ground against all three competing indices this week, but overall GOAU is still ahead since it began trading.