THE WIZARD OF RAMBUS
“A little over a week ago on December 8th I first posted the possibility that we could see a small H&S bottom forming at the last reversal point in the August trading range in the PM complex. Details were still pretty sketchy but there was enough information to start laying out the groundwork for how a H&S bottom could form.
December 8th.
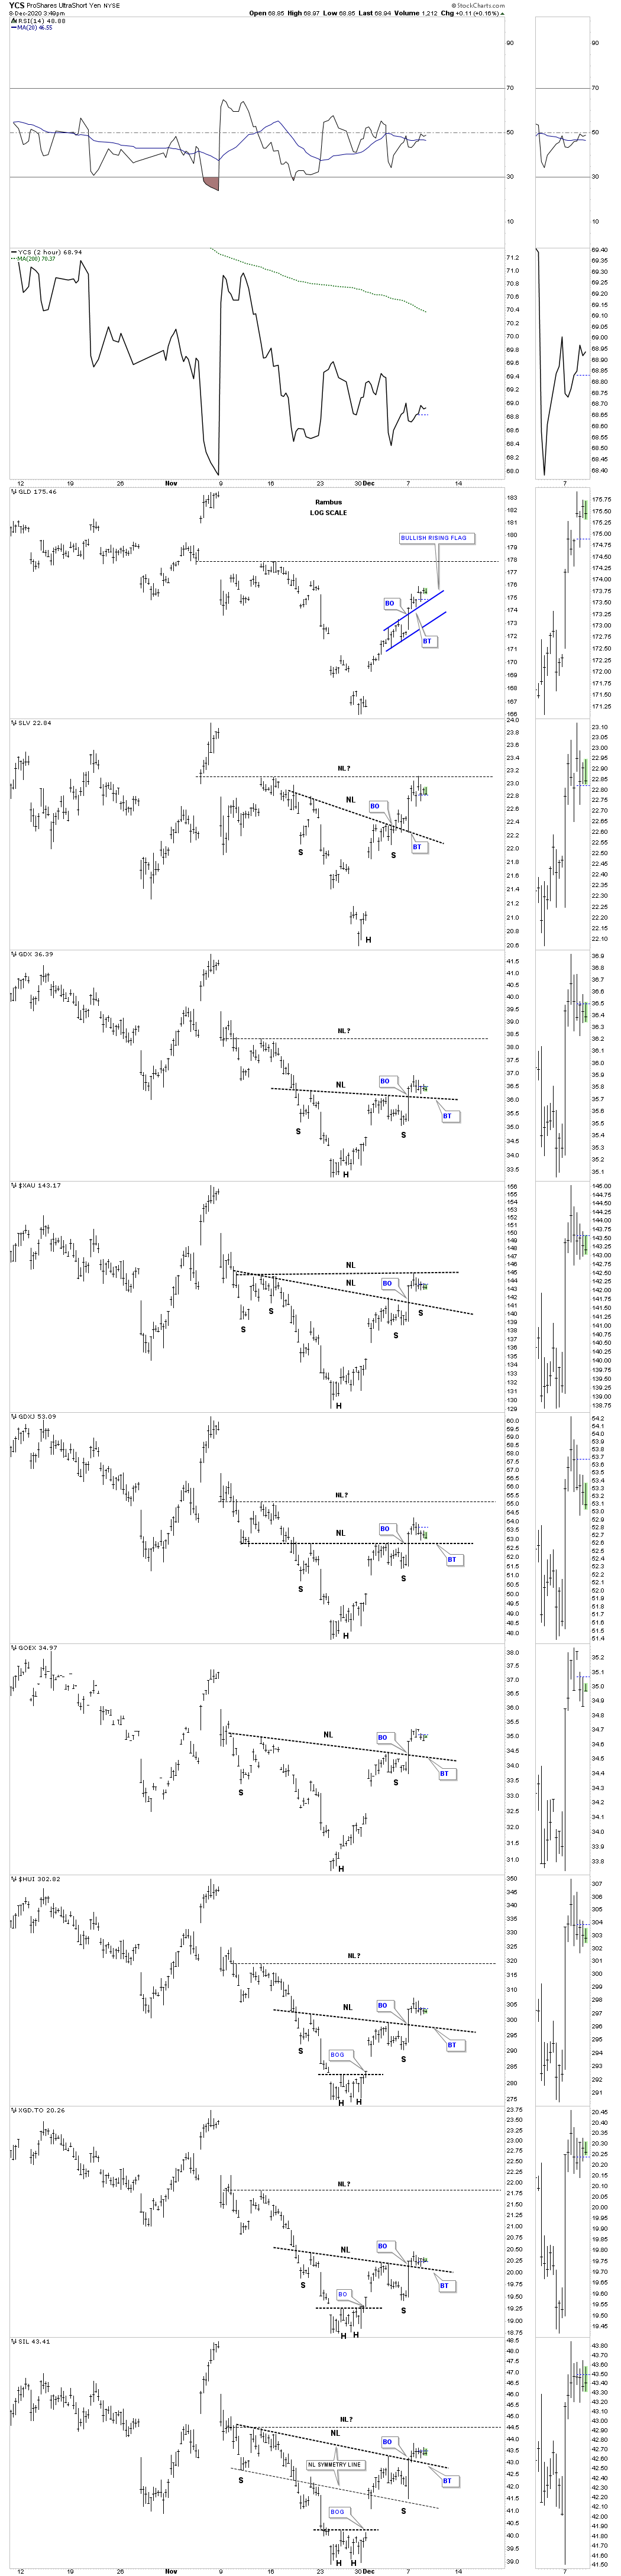
This next PM combo chart is a 2 hour chart I just built today. Usually at the important reversal points in a consolidation pattern many times you will see a smaller reversal pattern form at the reversal points. Since we could be seeing the possible last reversal point in the August consolidation pattern I finally got enough information to layout a possible H&S bottom which is very small at the moment but could morphing into a bigger H&S bottom. We should know in the next day or 2 if the potential neckline is going to hold the backtest from above. The thick black dashed horizontal lines could be the neckline for a bigger H&S bottom but again one step at a time.”
Click twice to enlarge charts
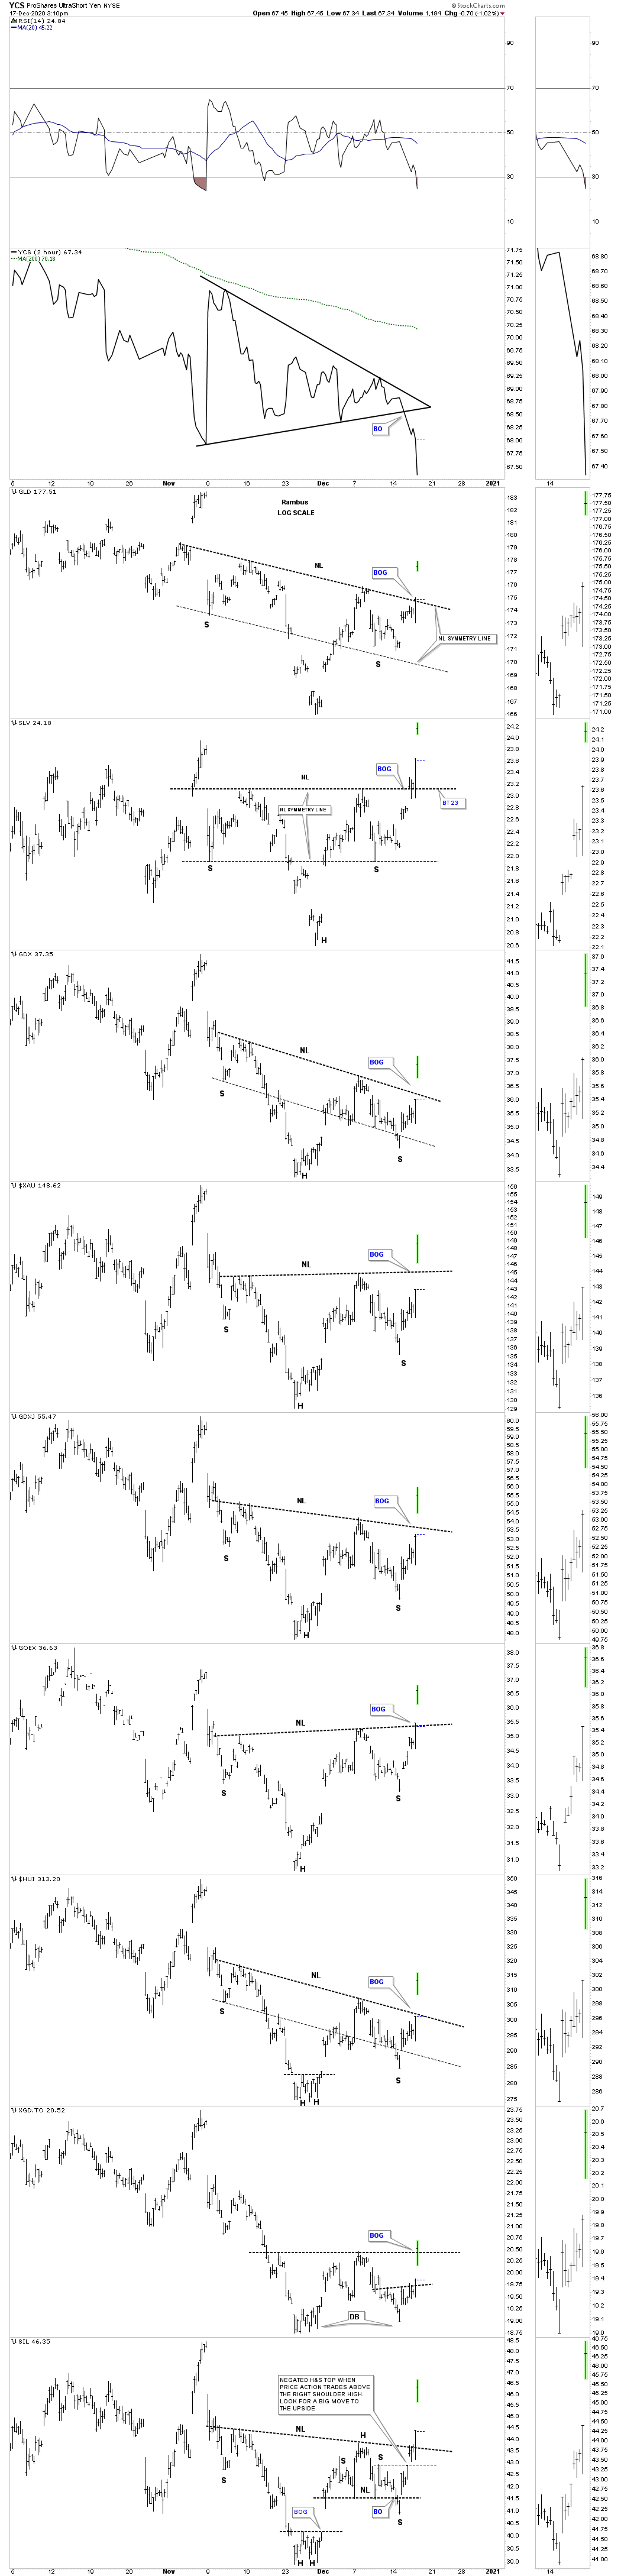
Back to the present December 17th.
Yesterday when we looked at the 2 hour chart for the PM complex SLV and SIL were the only 2 to have broken out of their very symmetrical H&S bottom with the rest trading just below their respective necklines. Today the rest of the PM complex joined the party with their own massive breakouts. What you are seeing today is a classic breakout move from a Chartology perspective. The only thing we can’t know yet is if we’ll see a backtest to the necklines. The XGD.TO wasn’t showing any type of reversal pattern yesterday which is kind of unusual. Today I was able to figure out what the bottom reversal pattern was which appears to be a double bottom with the breakout today above the double bottom trendline. Also yesterday I highlighted the price action on the SIL chart leaving the small H&S top in place suggesting that when a H&S top fails, price action trades above the right shoulder high, the H&S pattern is negated you can see a big move in the opposite direction and in this case up.
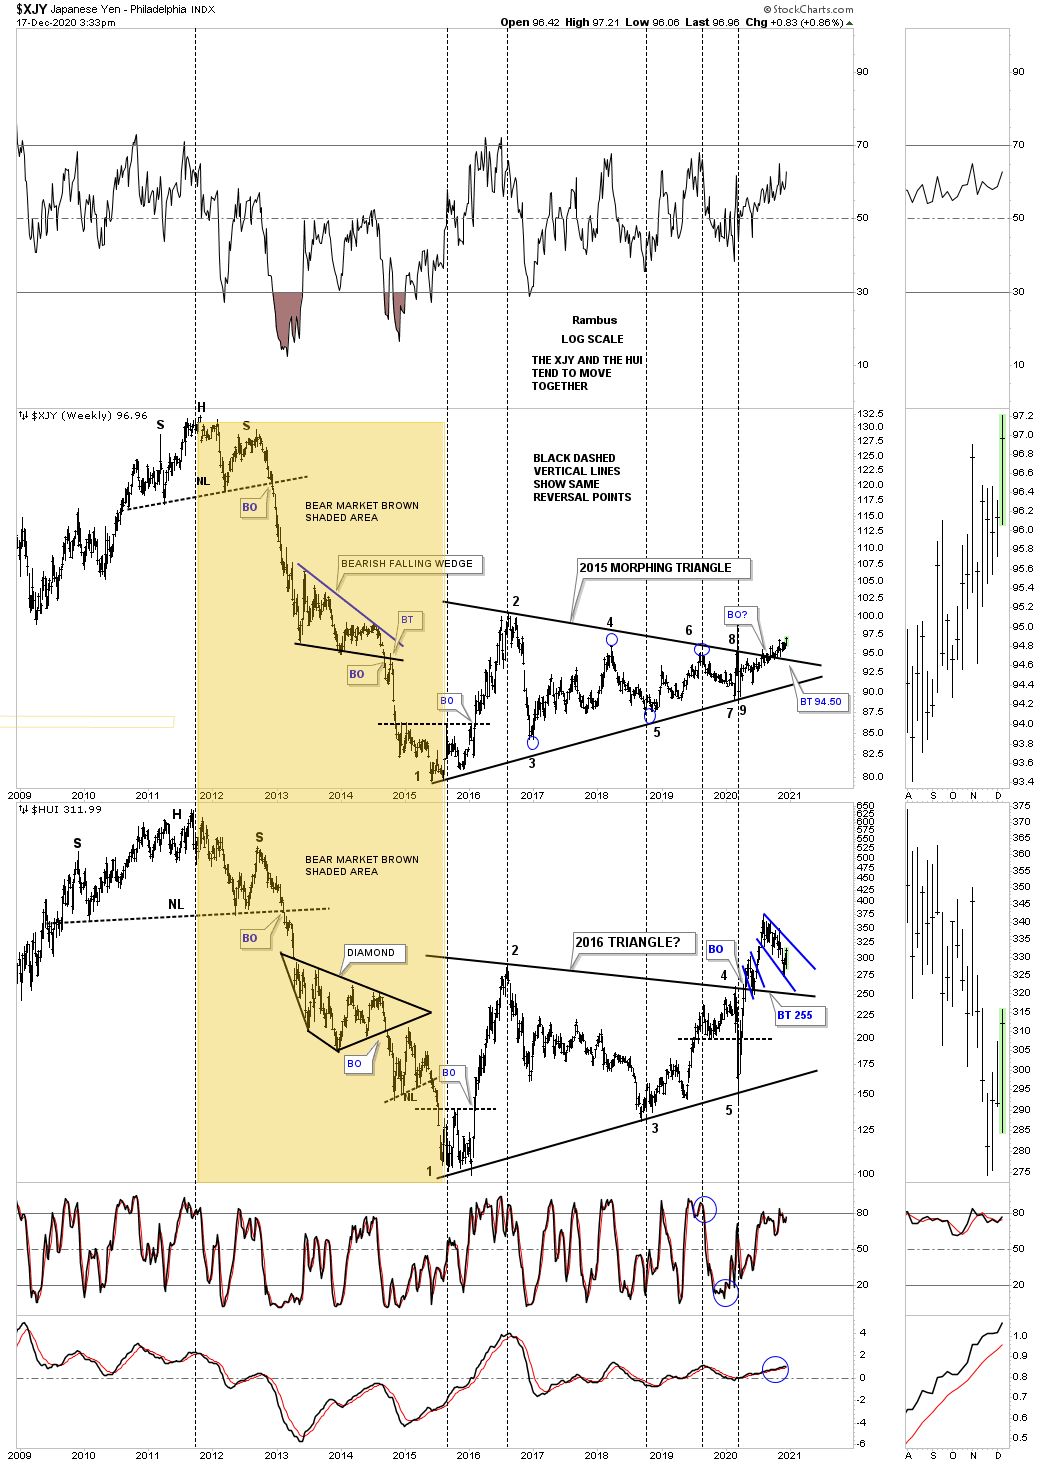
This next combo chart has the XJY on top with the HUI on the bottom which shows how these 2 tend to move together. I always state that it is not a tick for tick move but how they generally move together and how they tend to reverse together at important turning points as shown by the black dashed vertical lines. There is a bullish development this week on the XJY that is making a new higher high after breaking out from its 2015 triangle reversal pattern. The positive correlation between these two strongly suggest there are many years of bull market price action going forward.
Full Report with many Individual Set Ups here ( For members )