Latest BC CDC Covid stats
Latest BC CDC Data on Covid for the period May 1 to June 25 2022. Remember this is the GOVT.
The Boosted are 52% of the population but are represented above their % in Hospitalization, Cases and Deaths. I don’t look at cases as its not accurate. For the past 8 weeks the Boosted don’t look so good in any of the categories.
The Boosted sure do take up a lot of hospital beds though it’s the Deaths that count. Presently 9 out of 10 Covid deaths in BC are shotted. Great advertising for Effectiveness.
But we still hear, “Glad I got vaccinated, it could have been a lot worse”. Of course not for the ones in the Death column, yikes!
A Pandemic of the Shotted. More shots one receives the greater likelihood of death.
How long will they continue to post these numbers.
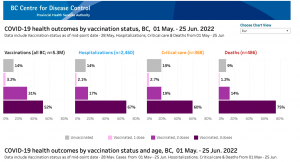
Amazing chart, isn’t it? The most damning picture is seen when you follow the Booster bar from left to right. The booster make up just 52% of the population but you find they make up 67% of the hospitalized. But the big jump comes in the deaths: here they are 3/4s of the dead.
If you think of Vaccination as entering kindergarten and Hospitalization as graduating from Grade 6, and then Critical Care as graduating from grade 8 and finally DEATH as high school graduation… then getting that third booster is giving your “child” the best chance in life to become a High School graduate! Ask any teacher, “I don’t worry about my boosted students making it all the way to a high school diploma (ie. death certificate) it’s virtually guaranteed.”
Also, the unvaccinated are less likely to die than the injected. The government chart shows it.
I don’t understand the one shot thing. Complete anomaly.