GDXJ
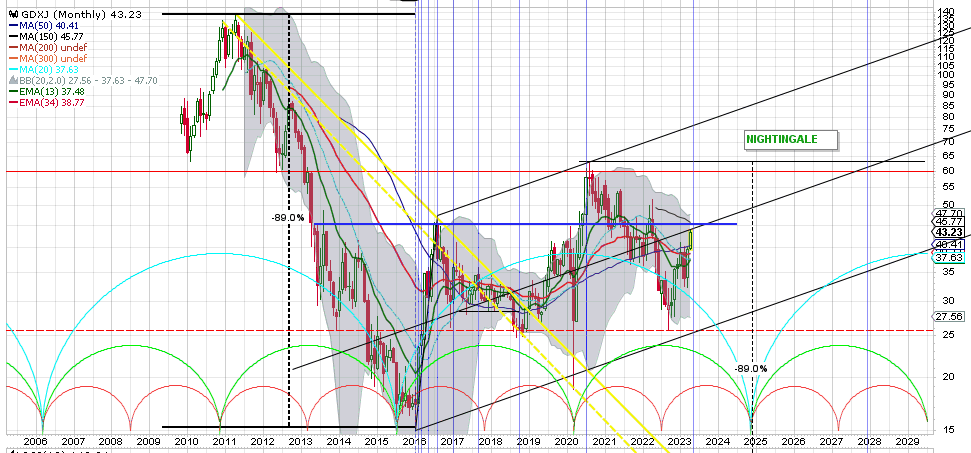
Here 15-year monthly GDXJ.
Still approx 70% below its’ 2011-top. This GDXJ-chart is more or less same instructive as earlier posted GDX chart.
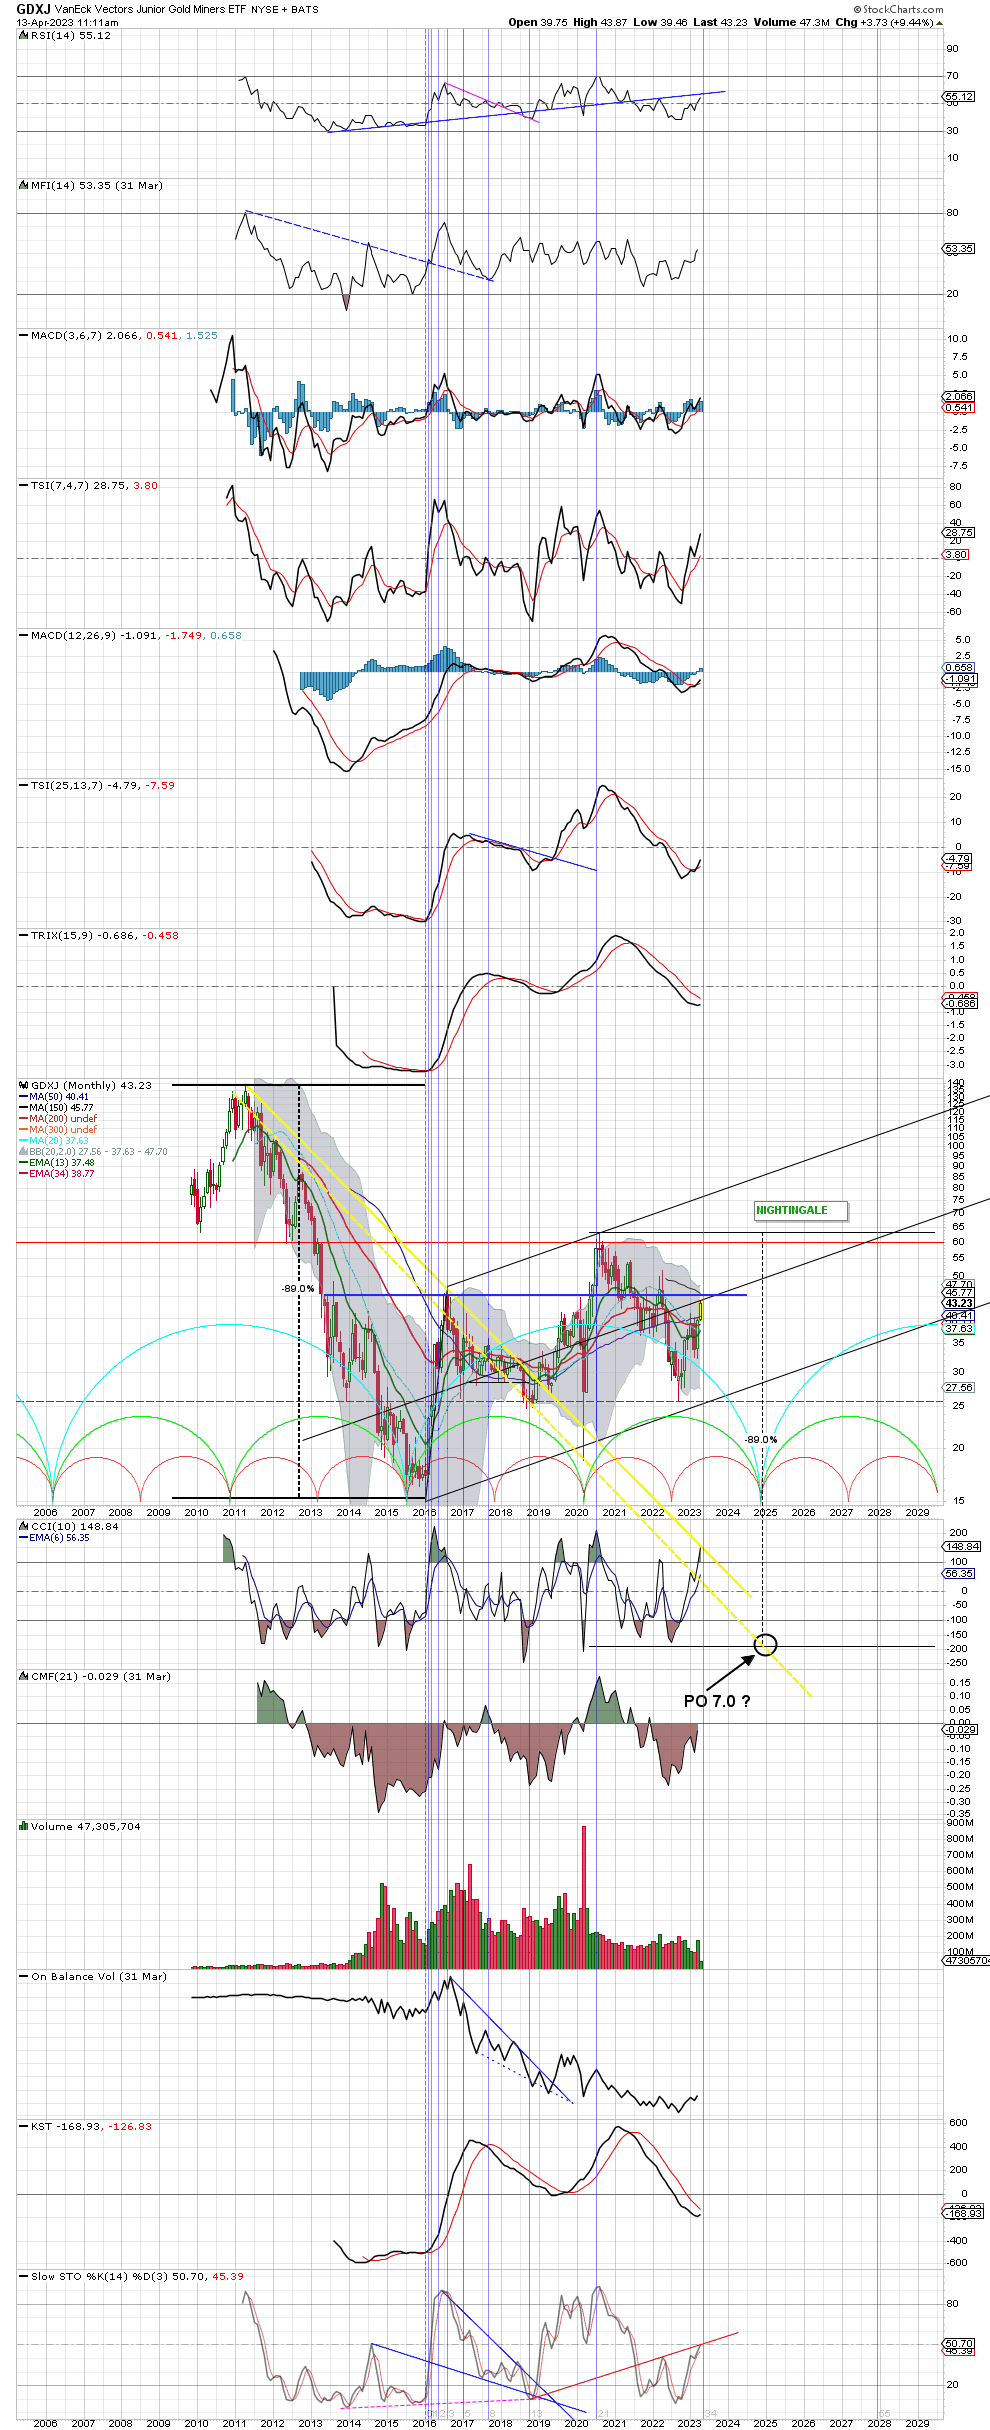
Indicators give same reading while both RSI and Slow-STO are against charted RES. Also charted CYCLES give same view eg. targeted LOW during 2024-Q4 with a MASSIVE PO of 7 which is measured (halfway).
So BULLS be EXTREMELY WARNED but probably will not matter warning-bulls hence goldbug.
Furthermore . . . GDXJ needs to get over the BLUE HOR RES line and with some imagination, one can still observe a H&S. So the H&S-pattern is still there as long as the BLUE-HOR-line acts as RES which also meets M-MA(150) @ 45.78.So Junio-bulls need to push it higher from here. BLACK FORK is interesting and could be a LARGE BEAR FLAG and functions as HALFWAY PATTERN DOWN – again targeting PO @ 7.0 (minus 84% from today).
Last remark: the Vertical FIB’s taken from 2016-LOW are interesting as next FIB comes May-2023; maybe -1 month = this month.
As the month is still running – I will update both GDX and GDXJ at the End of Month (EOM).
IMO. DYODD.
NG whats you view on the US Dollar Index ?
FGC, I mentioned before that as long as USD is above 101/100 then USD is still in BT-mode and nothing to worry (for USD). I will repost.