Selling Bitcoin Short (live trade now)
Yesterday I related how I missed a really beautiful Bitcoin short entry. Today we have another setup in play right now. So I have taken this trade that has evolved 14 hours after Bitcoin hit its bottom at 26,700 yesterday. Price has bounced back since then and hit the 50% Fibonacci mark to near perfection (see chart link). That is where I placed my entry of 10 lots as shown.
So far, so good.
The point I selected to sell also happens to be the Bollinger Band mean which is the center orange line you see there. That line is the 20 day Simple Moving Average. It is curious how its price almost perfectly coincides with the Fibbo 50% line. (Fibbonacci’s bands are not shown here in order to reduce chart clutter) We see a lot of that though so are not too surprised. What may be helpful to other traders is how a variety of indicators are all confirming that I might have a good valid entry. Nothing is guaranteed of course, but this trade looks very nice.
My profits are 440 dollars as of the time I wrote this post. I have a stop loss placed 100 dollars above that will cost me about a 1,000 dollars if taken out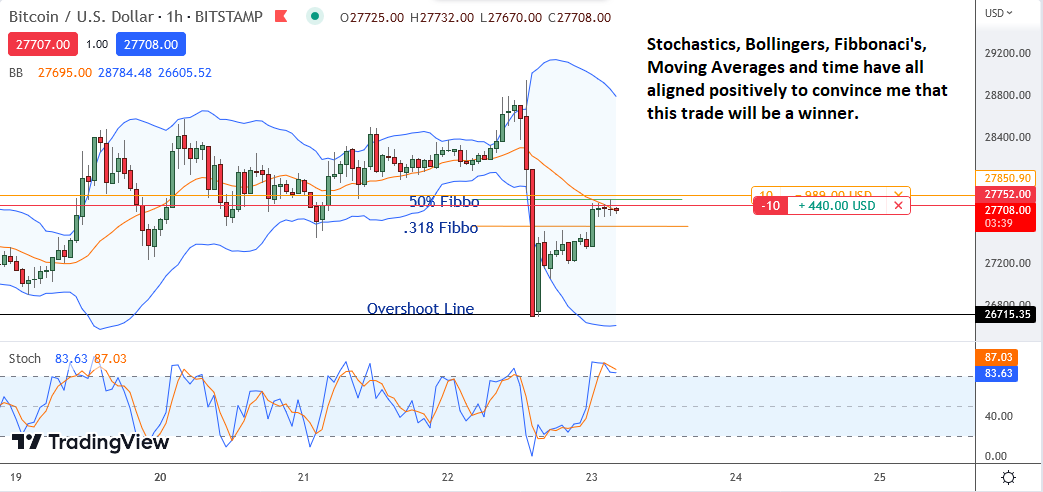 . Essentially, price went into the green from the moment I placed the trade and it has stayed green ever since. I really prefer that kind of trade over those that immediately go underwater and then drown you an hour later! This trade, if successful, should generate at least 22,000 dollars over the coming hours/days. Do your own Due Diligence if making a similar entry. I can only tell you what I am doing and that I bought it because the opportunity looked very favourable.
TRADE WAS EFFECTIVE FROM UTC -5 March 23rd (That’s 5:00 AM Central Time…Chicago time in other words)
“I really prefer that kind of trade over those that immediately go underwater and then drown you an hour later”
Hey Farmer you discriminating against ALL my trades ? What you got against “losers”
🙂
Good luck …go get em