The Copper Top
Copper, Monthly 40 plus years of history
I built this chart several years ago, I think at the close of year 2015.
So far the chart shows a 7 year time frame, bottom to bottom, then 8 years, then 7, and finally another 7.
It looks like we have another top in place.
Will a bottom happen again at a 7 year time frame, bottom to bottom, or maybe at 8 years this time, or something else?
If it is going to happen it is squeezed for time and likely to be in a hurry, as in 2008.
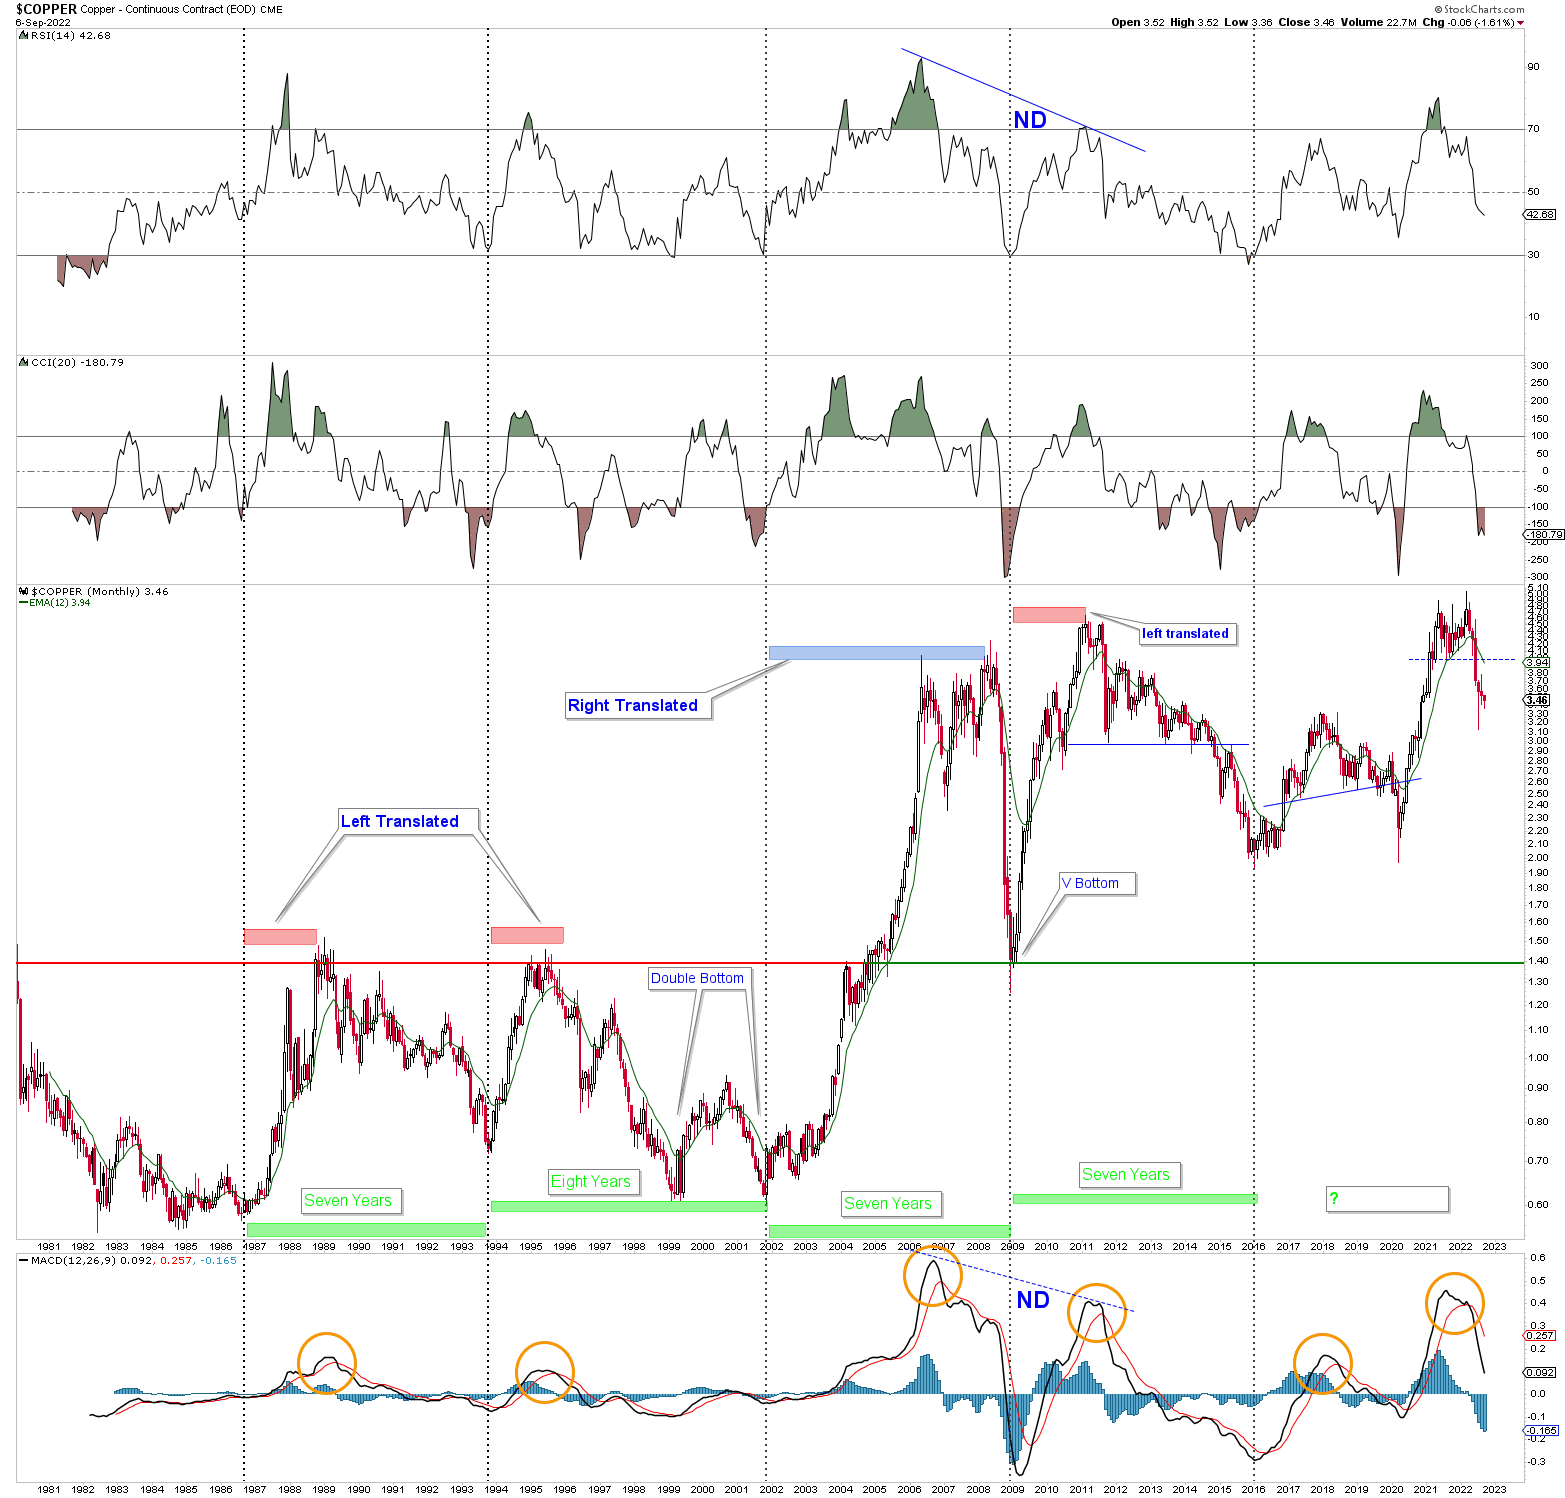
Notice the RSI at 30 for each of the last 4 times copper found a bottom.
Thanks for the chart.
There has been a lot of talk about “The Grid”. How it will not be able to handle all the EV’s charging at once. Not everyone can or will charge during off-peak times. Maybe there will be good incentives. I don’t know.
My experience is that most new housing the past 40 years comes standard with a 200 amp panel but there are a lot of 60 and 100 amp services still in older homes. GMG has noticed that on Christmas Day with all the electric ovens in play on our street (every house is occupied) there appears to be scaling down of the efficiency. Our subdivision’s services were installed only 25 years ago. Anyone here who knows the scoop on what happens when the 200 amp panel is the norm in these older subdivisions? What about the transformers, etc? How much line upgrading is necessary?
Also, I understand that EVs use more copper than ICE vehicles.
Will there be a required update on many of the streets? Copper demand, will it increase as EV’s are mandated in new vehicle sales?
You make good points and ask the right questions Columbia. Getting back to Silver Fox’s chart, if the pattern holds the 7 year bottom should be in 2023 and looking at the chart, one would think it would be no lower than $2.00 but more likely somewhere between $2.50-$2.70.