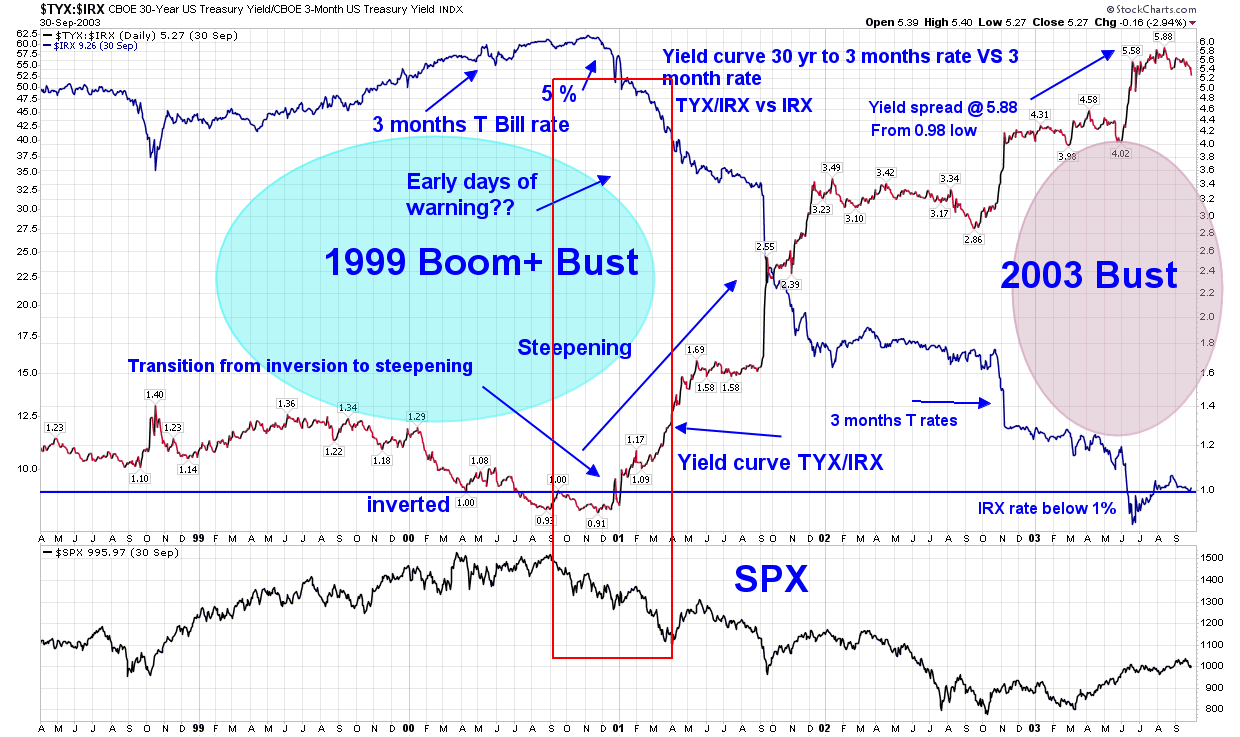
Yield curve TYX:IRX vs IRX Boom bust cycle 1998- 2003
For Patrick:
Current situation in credit market is incredibly similar to what happen in 1999 to 2003 and 2008 Boom- bust cycle.
Yield curve across the spectrum of treasury maturities went through the cycle of Narrowing during boom and at the top yield curve inverted for some time and began to steepening from inversion.
The featured Yield curve chart is of 30 yrs Treasury to 3 months T bill rates.
One important feature of boom is that 3 months Treasury bill (IRX) rates rises with expansion of economic activities, At the height of 1999 IRX rates topped at 5%. (not a typo). During that period Yield curve began narrowing to inversion. Later it started turn to steepening along with the decline with IRX.
As the curve began steepening IRX continuelly declined. That ensue the begning of Bust cycle.
Narrowing of Yield curve: Difference in Yield of longer maturities T bond and shorter term treasury is declining.
Steepening of Yield curve: when the difference is growing more and larger.
At the top of Boom cycle the curve was inverted where 30 yr bond yield was lower than IRX. At the bottom of bust in 2003 the difference rose to 5.58 bps from – negative. Huge delta.
At the top of boom Nsdaq index topped at 6000.0 and bottom was 1500.
Market experienced Similar boom bust cycle in 2008. AND the current market cycle seems to be on the same path once again.
If you study the charts it is signaling the same outcome once again after another 11 years. Of course there other indicator as well which enhances the theory of upcoming bust: credit liquidity measured by difference in rates between IRX and Libor3 rates.
Warning!!! From Yield curve 30 yrs -3 month T bill Boom bust analogy
Great scott! Thanks bikoo