Warning!!! From Yield curve 30 yrs -3 month T bill Boom bust analogy
Is market cycle at the same point in time as 2008?
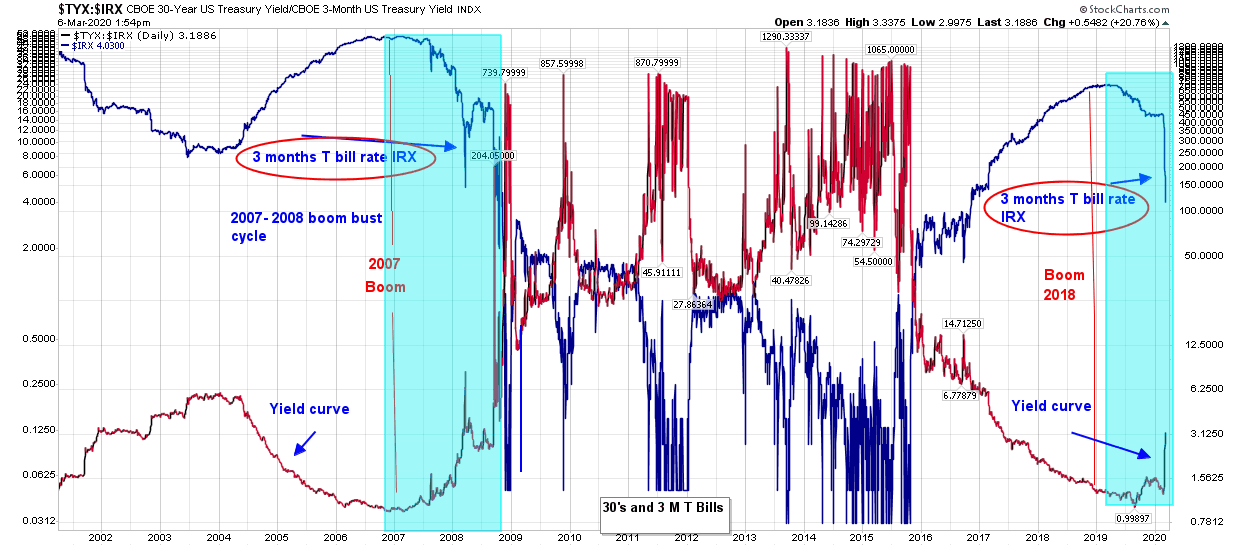
Chart gives the answer.
This is yield curve 30 yr vs 3 month rate spread vs the 4 month rate combo chart. Short rate is falling with same intensity as was in 2008 at the same time yield curve was steepening as was same in 2008 at this time.
a good short on a bounce may be in order with tight stop. More than $200 billion REPO has not helped and WH calling for rate cut to stimulate.
More like Massive QE…
Bikoo.. can you zoom in on 1999-2002 period? How did it look back then?
Yes . But you will see that dynamics at that time period may have different dominant financial factors at work. Periods after the crash in 2009 QE’s kicked in. that’s why the chart looks like an EKG of the market. Violent moves in credit markets. since 2017 it stabilized and sort of became orderly in credit market.
My guess is that relations will be different. Every financial cycle has different dominant factors.
I was afraid you answer that ;( Indeed … context wasn’t the same… soo much fun!