Looking Back – Where Are We Now ?
You might remember I posted this chart back in May https://goldtadise.com/?p=444548
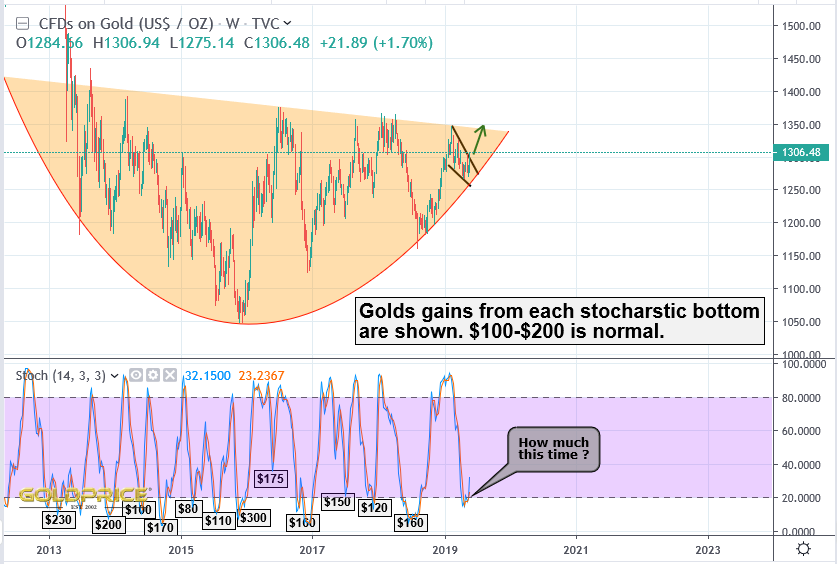
Here’s the same chart, brought up to date…
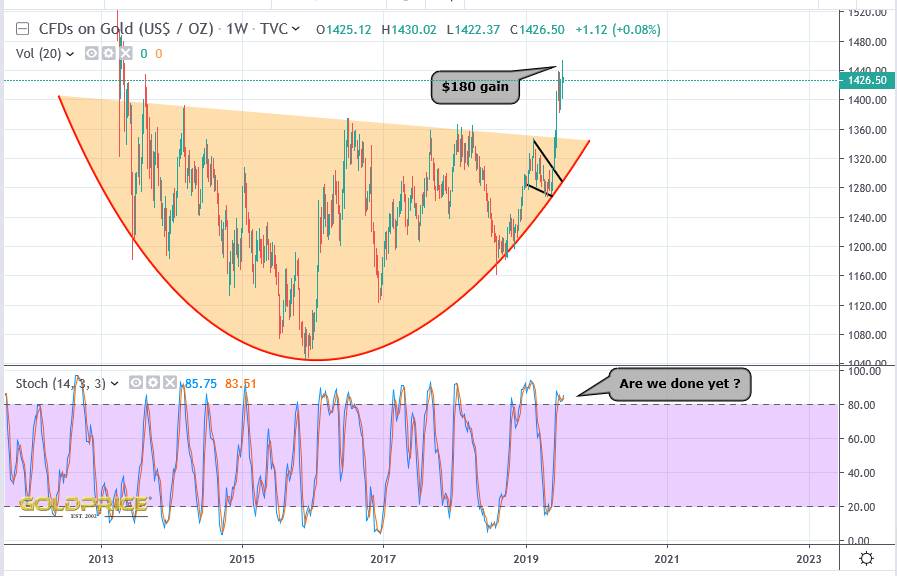
Since then, I’ve adjusted the ‘golden bowl’ in my conceptual model (the top of the bowl is now at $1600), but the base/support of the bowl is in a very similar position, currently providing support in the $1300 region. Any large correction should be supported there, and unless it’s breached, I have no concerns at all.
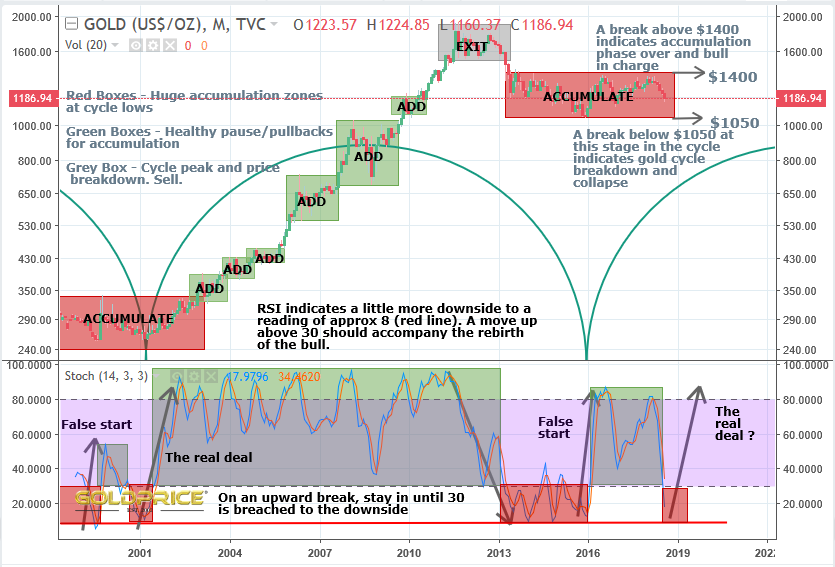
Here’s another blast from the past, this time last August https://goldtadise.com/?p=433668
Here’s the update…
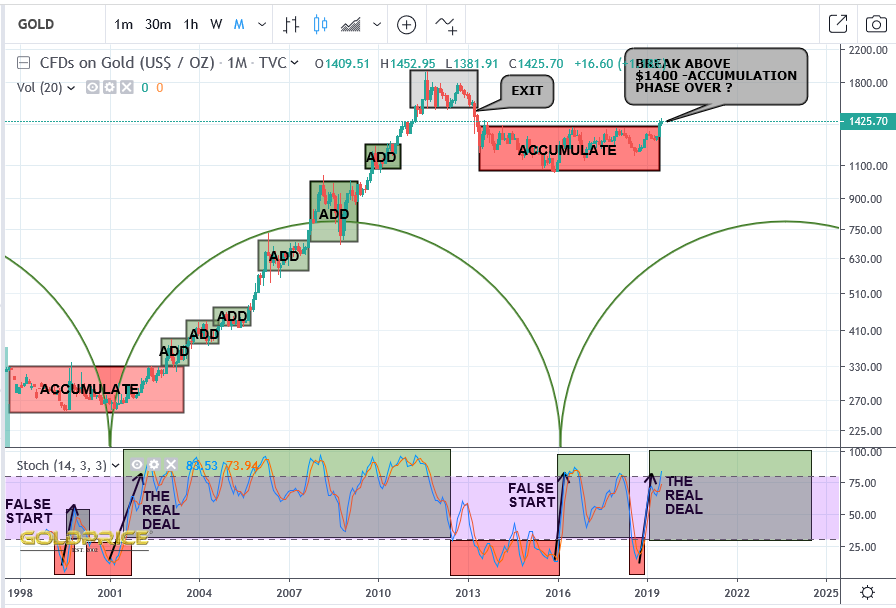
Everything seems to be progressing well, and I have no reason to reconsider the bullish outlook unless $1300 is breached to the downside. It’ll be interesting to revisit this post in another 6 months or so – looking back at the end of the last accumulation phase, we may spend quite long periods of time oscillating around in ‘add’ zones. Also noticed I put the start of the 16 year cycle in a somewhat debatable position – but I do find the exact cycle lows can be a little out of sync with the actual price bottoming, so I try to only use it as a rough guide anyway.
Appreciate the updates, Meteorological Man. Helps calm the mind and focus on the slow and steady…..
Great help to us, Northstar. Keep on shining. 🙂