Triangles, Price Channels and Cycles
Looking for clues as to where gold price is going and when. The ‘when’ bit is probably a little easier if you use the longer term cycles, and don’t worry about weekly fluctuations. From that perspective, as I’ve already shown, we can expect a resolution within 6 months (and it should be much sooner than that). There are many indicators suggesting that a sizeable move could be in the pipeline. The historically low Bollinger Band width for example, as well as the Gold Sentiment Indicator, which is at levels which historically mark important lows. If you tie all of that in with a look at where we are in the larger, more powerful cycles, it leads me to believe the eventual break will be to the upside.
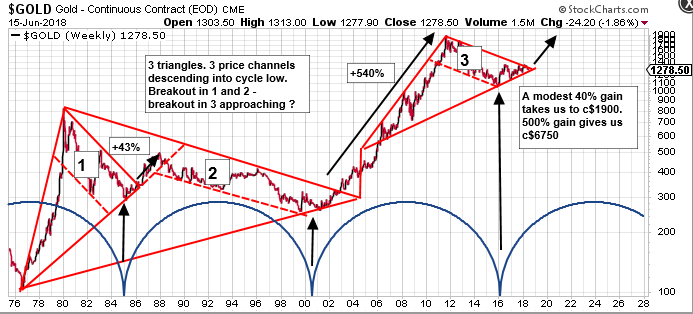
I’ve posted charts which show we have very little room to move here. A short, sharp move to the $1250 region is possible, but would temporarily ‘break’ some of the charts, and be very troubling. Absent a rapid recovery, we have some very scary scenarios from the charts. All that said, though, I’m still a gold bull. Just take a look at the chart below. Triangle formations, trending downwards in a very definite channel into the apex at the cycle lows. This is very normal, and what you’d expect. We now have the powerful 15 year cycle at our backs, so this should do the heavy lifting and give us the breakout. From the point of breakout, the last 2 cycles took us up approx. 40-45% and 0ver 500% respectively.
Zooming in a bit, there is strong evidence that we are very close to a 6 month cycle low. Gains of the order that we have been seeing out of these lows recently, would give us the long awaited breakout.
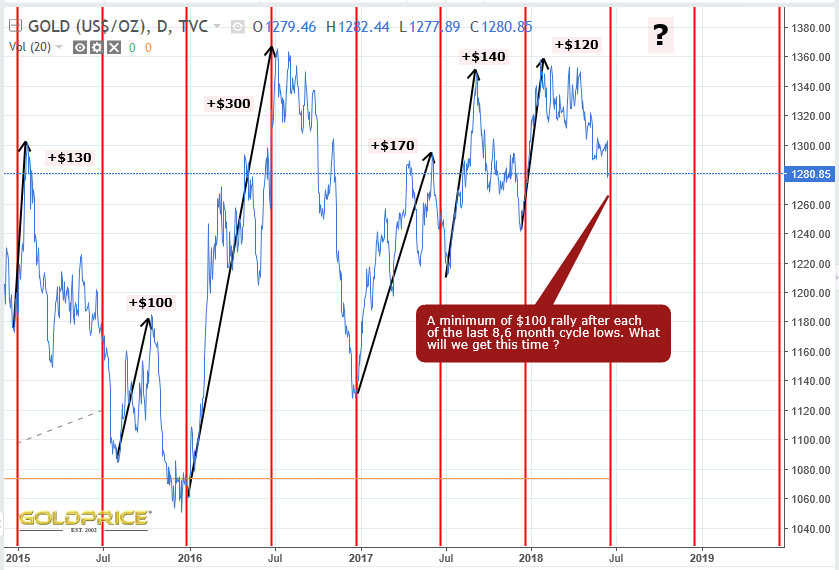
The next 2-4 weeks could quite easily give us some long awaited answers.
Excellente
The question for me is, from what level will we get a rally? 1270$ for gold seems like the low to hold for me. And what to expect next? A 1 month rally like in January 2018 ? or more the usual 5-6 month rallies we use to have in metals like in 1H 2016?
If this is indeed a new bull market for gold, I’d expect longer, stronger rallies to develop over the next 12 months with shorter pullbacks. Those more expert with the shorter cycles might have an opinion on that…