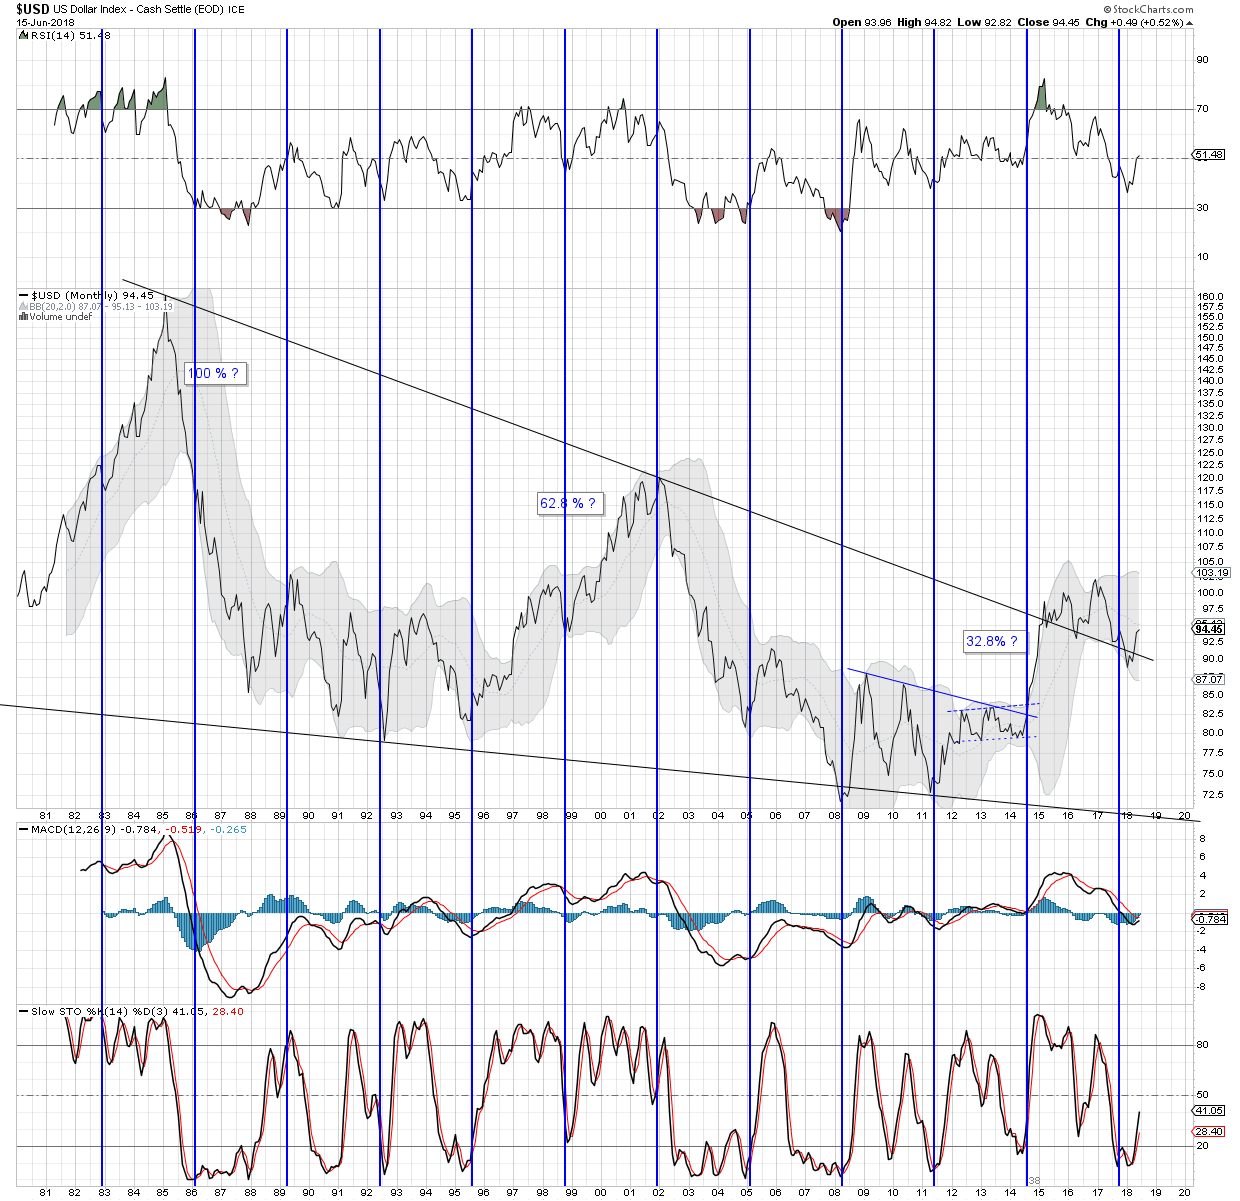
$USD monthly chart with 3 year cycle lines
Notice the 1985 peak labeled 100%, the 2002 peak labeled 62.8%, and the 2016 peak labeled 32.8%. That was from Schism’s observation (projection) some years back. It seemed to work so left the numbers on the chart. Fibonacci strikes again !
The question is, are these 3 year cycle lines placed where they should be? Not sure.
Not as easy as that I am afraid silver fox!
The 3 year lows are Apr 2015, Oct 1998, Sep 2001, Dec 2004, Mar 2008, May 2011, May 2014, May 2016
Now an explanation…on a monthly chart
The last 3 year low was May 2016 after which the USD peaked in Jan 2017 and began it’s 3 year decline making lower lows and lower highs….until Sep 2017 when it hosted a YCL (yearly cycle low)
The USD then advanced and peaked in Nov 2017 (confirming Sep 2017 as the YCL)
It then fell and made lower highs and lower lows until Feb 2018
Since then the USD has made higher highs and higher lows (along the way confirming Feb as the YCL)
If it surpasses the Nov 2017 peak of 95.06 then it confirms that it has left behind the 3 year low based on the cycle premise that once a cycle fails and then goes on to print a new high then a new cycle has begun.
I am expecting the USD to advance and form a left translated daily cycle over the next 2 weeks before declining and therefore confirm an early 3 year low has been left behind in Feb 2018
We shall see…
If the USD pushes higher above 95.06 that is going to scare the pants off gold enthusiasts and we are going to be presented with a remarkable opportunity to buy some miners at bargain prices.
It may take awhile – things will start to warm up next week but do not be surprised if we see a “double bottom” as we did in 2013 and the final low for gold extends into early July.
That failed left translated daily cycle for the USD normally takes a 11-16 calendar days before it peaks commencing 14 Jun.
Thanks for all your charts silver fox – great stuff!
Thanks Silver Fox, and Norvast. Really helpful.