Chartolo Doodles
What do we have here from a pure Chartology Perspective ?
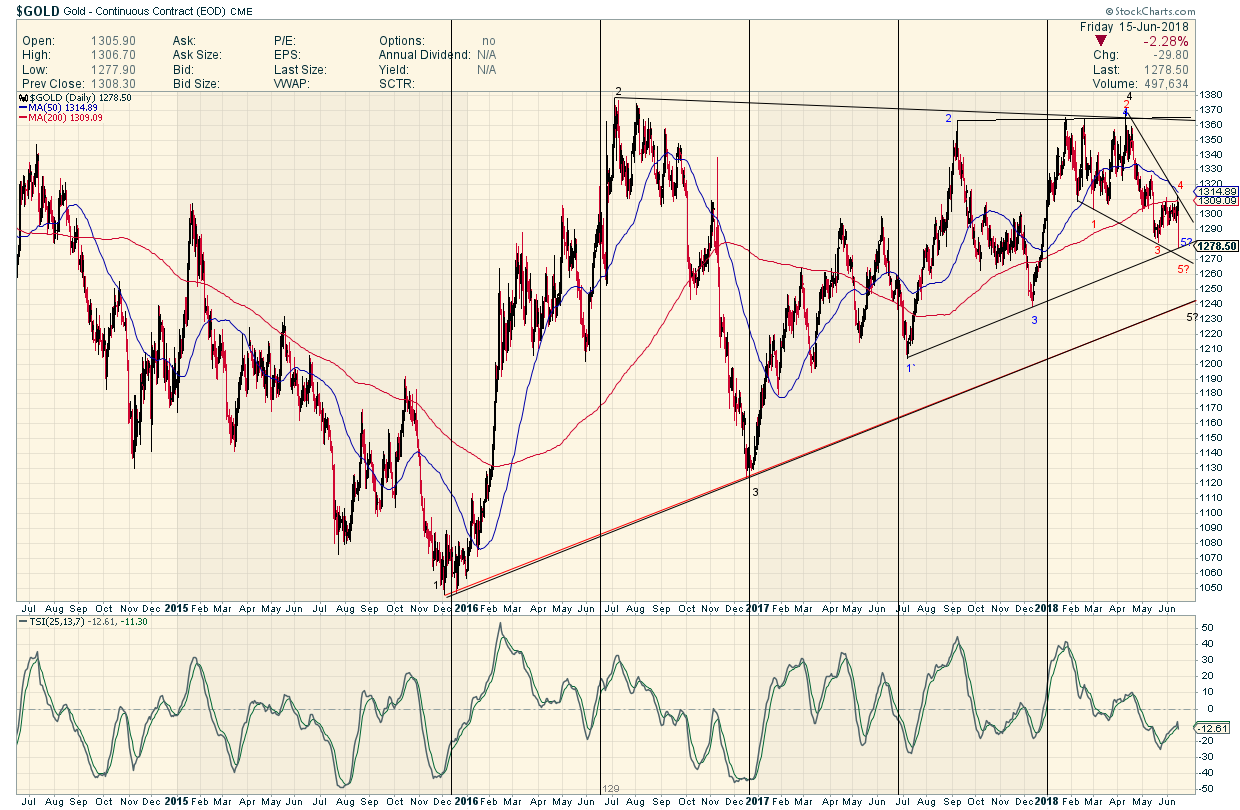
3 patterns
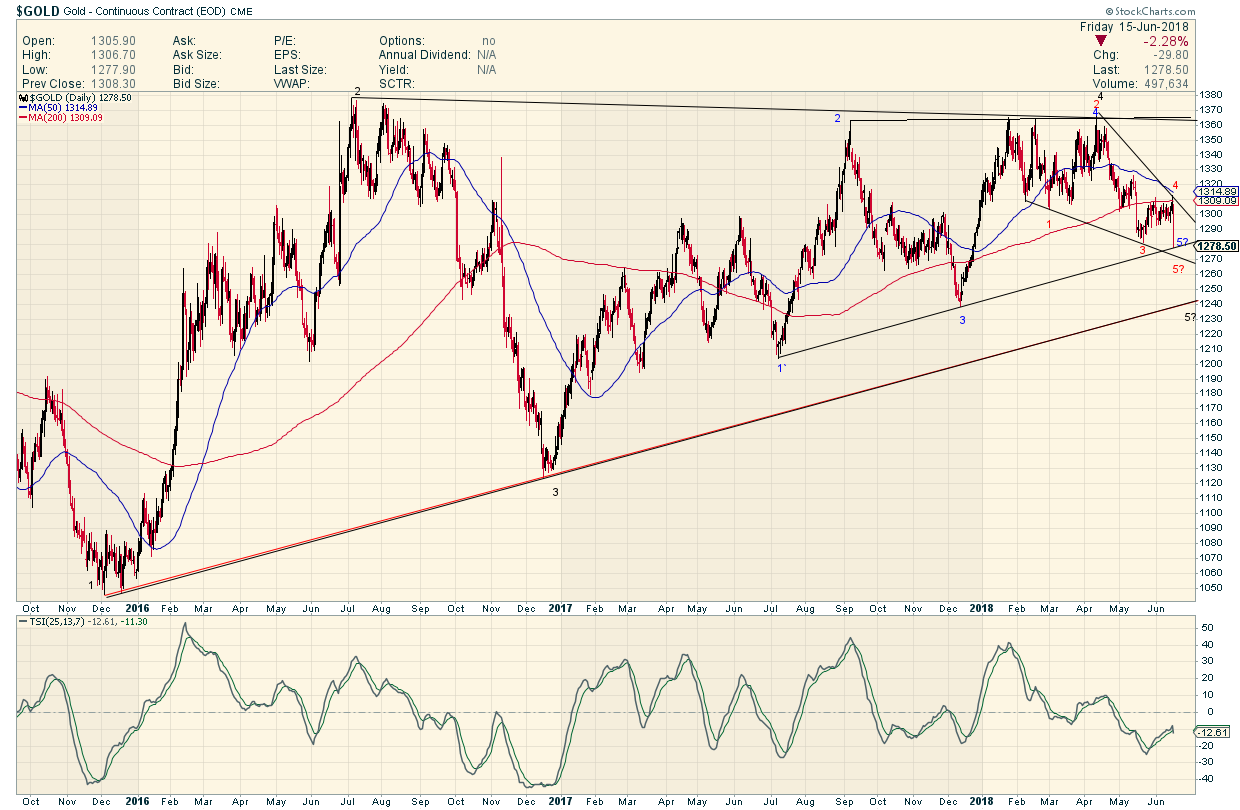
Black Numbers show potential Support at Point 5…could get scary but its strong support for now
Blue Numbers show a direct hit on Point 5 with Fridays carnage…will this hold ?
Red Numbers show slightly lower for point 5.
There you have it…three point 5s
all labelled 5? …because they have the POTENTIAL to be reversal points BUT will not be labelled as such UNTIL a reversal is complete ( top lines are once again hit )
Capiche ?
One thing is for sure…we have a LOT of higher lows on this chart , since THE bottom in Jan 2016.
But we are in serious NEED of a Higher High
Who Ya Gonna Call ?
Added….Every 6 months like clockwork we get an Important Low….we are due …get ready to back up the truck at 1240
good stuff sfgc. Euro at hot spot as well, cannot see it going down without more of a fight, Draghi obviously too chicken to quit QE until he is out. So much pressure everywhere, what is going to the snap? Socrates has wells fargo, deuche bank and hsbc on suicide watch list, seems best to sit on cash and just wait it out and go fishing … gold is ending the seasonal june draught also but been down that road last year…..
Nailed it Fully. Spot on 🙂