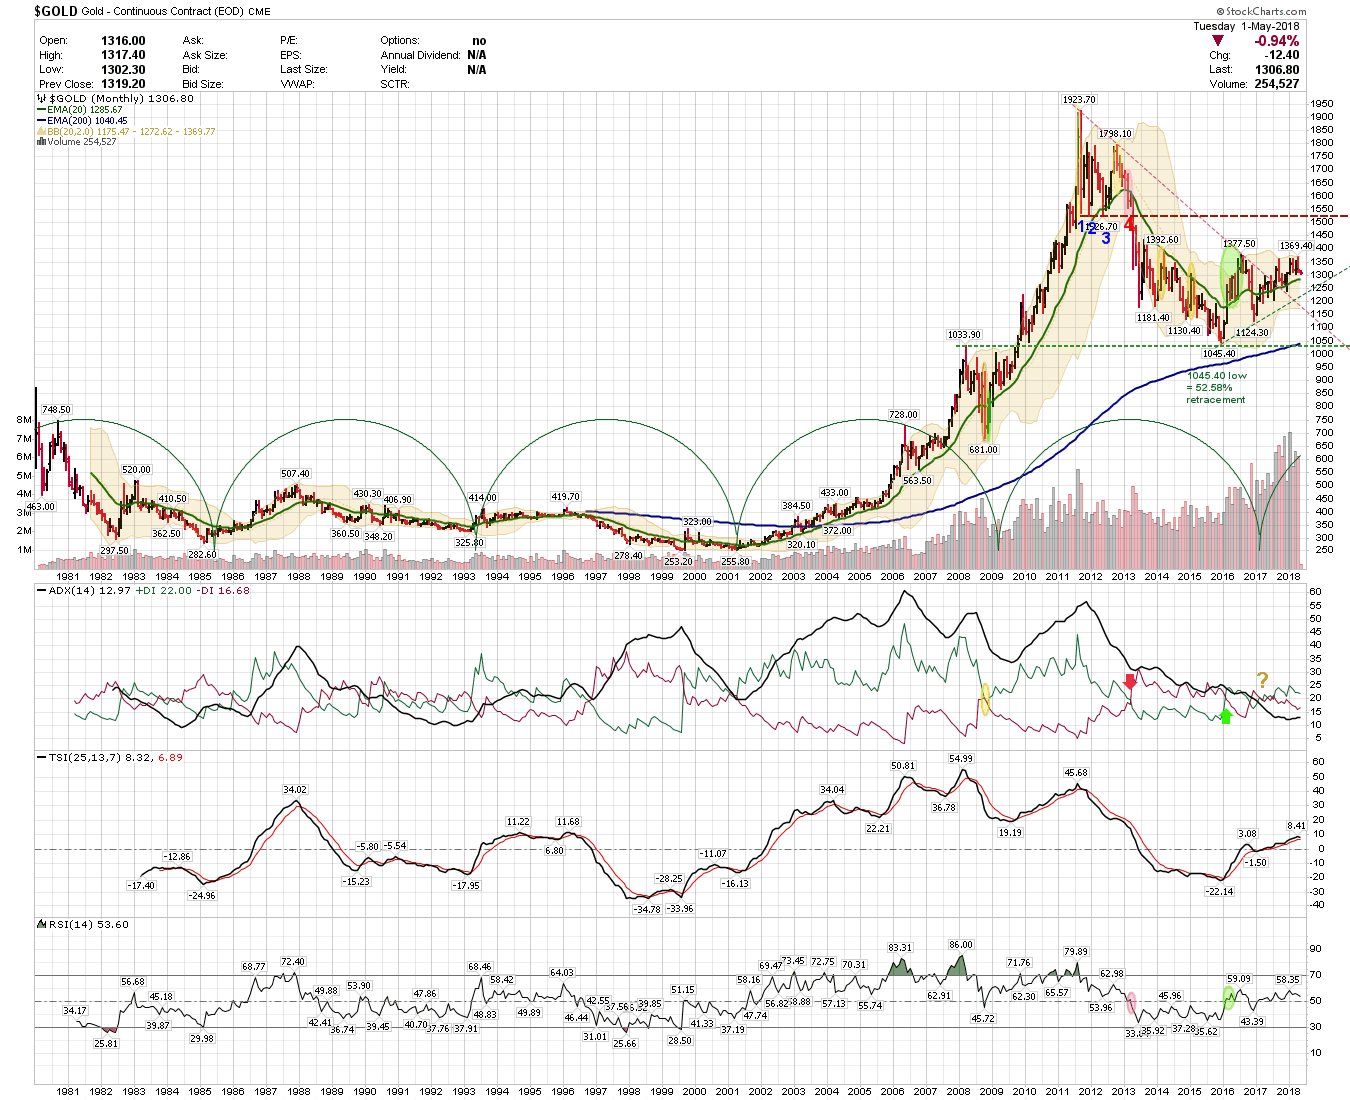
Simple Charts for Knuckle-biting Time
Each of us can find charts to offer bullish and/or bearish cases. Presently (and with good reason if observing the US Dollar Index!) it’s very easy to see a grim and forbording situation for gold, so I’m posting two charts and an article from Ross that I previously posted back in February.
(The monthly bar chart with an eight-year cycle and a 20-month EMA in green I deem to be the most important of the two.)
I’d appreciate comments, positive or negative, from the brains in this community, of which there is no shortage.
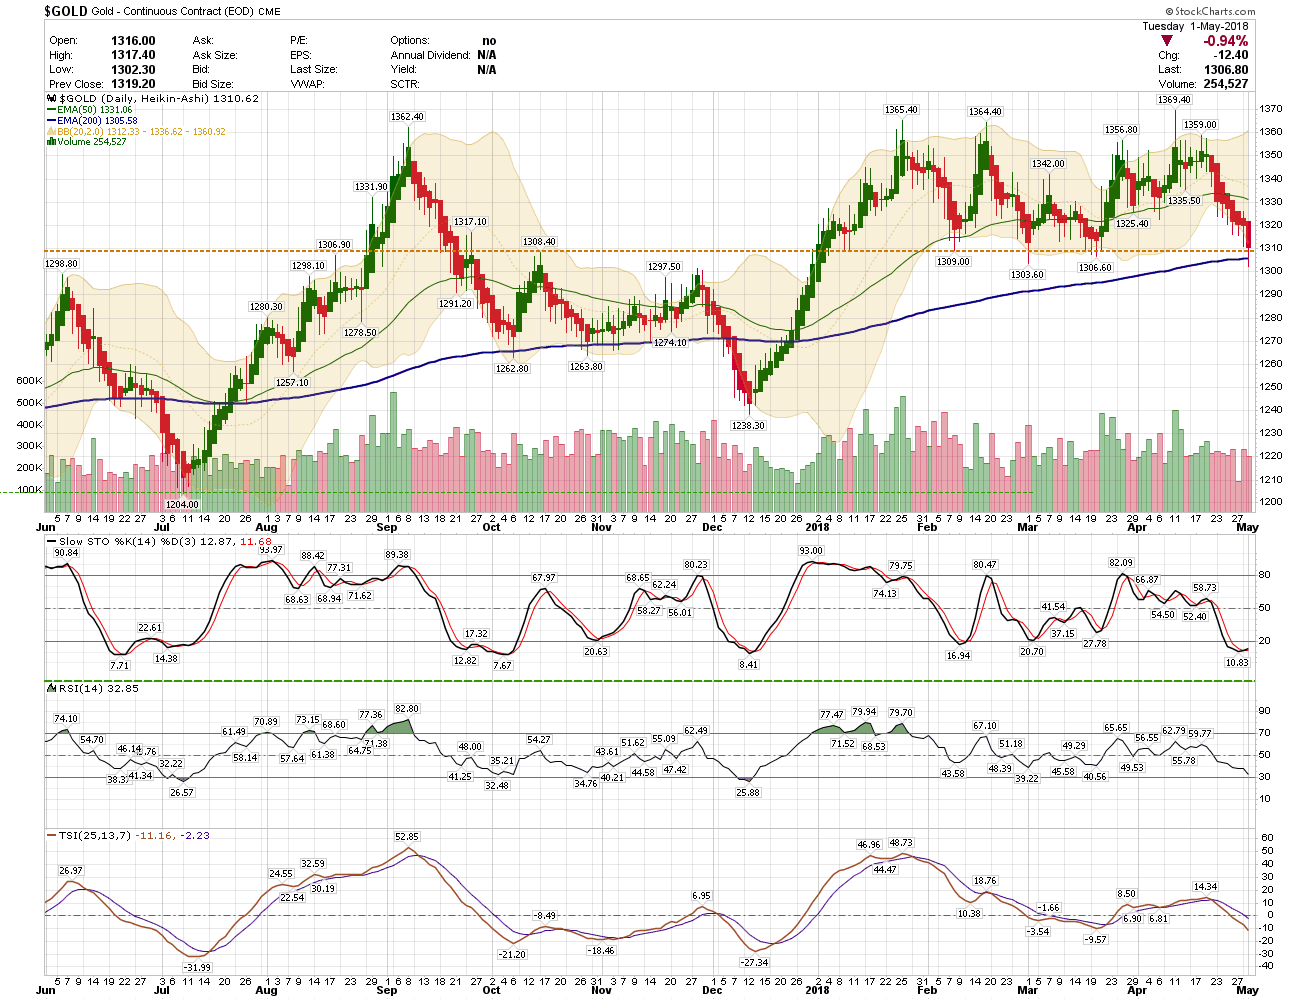
Here’s 2 cents worth… I like your first chart with support at the rising trend line, $1250 – $1270. It fits with the ICL, the rising dollar, and makes a pretty 5 point reversal pattern for the gold bear. Just my opinion. Anything can happen, and no doubt, anything will.
on the monthly chart: you definitely have the big picture.
you will want to add price patterns. for example, note the price action over the past 5 years, which is printing a bullish “inverted” head & shoulders pattern. This is where the action is in the near and intermediate term. These market-familiar patterns will either complete or fail in spectacular fashion:
http://schrts.co/pKjRNi
Shorter term: i see you’ve defined support levels very well! you can also drill down further on the patterns. The ascending support line of the “right shoulder”, and relatively flat resistance line (the “Neckline”) prints a bullish “Ascending” triangle, which I interpret as follows:
http://schrts.co/jK6Jee
it helps to know the underlying psychology of some of the familiar price patterns. for example – the ascending triangle = as sellers continue to cap rallies at the same price level, buyers have been willing to step in at ever increasing price levels. that’s why the pattern is bullish – the buyers will absorb overhead supply in this fashion and eventually overrun the sellers. but then – most savvy traders know this, with whom you are competing against…
Interesting to see yhe gold cycle low placed in 2017 rather than 2016. I often wonder about that – it does seem to be a good fit.
Northstar,
The 8-year cycle in the monthly chart above is actually off by about 6-8 months. The 8-year cycle should begin with the 1976 low of $102/oz. basis Spot Gold. This chart is actually more accurate and shows the recent 8-year cycle low to be in late 2016. Green up arrows mark the actual price lows.
https://goldtadise.com/wp-content/uploads/2018/05/Gold-8-year-Cycle-w-USDRSI-05-01-18.png
Two things to note in this long-term monthly bar chart of gold: (1) the 50 level on the 14-bar RSI clearly identifies the major Bull/Bear trends – consistently above 50 = Bullish Trend, consistently below 50 = Bearish Trend; (2) IF the US Dollar Index is about to enter a significant rise (back above 100) then gold could drop back to $1,125 and possibly as far as $1,056! But looking for gold prices at $800/oz. or even lower is an extremely low probability bet.