A few charts to ponder as we drift into Friday
YEN should be moving up in a three-way corrective. As this is a Wave 2 should reach at least the 50% mark… Note all indicators on buy signals today… Where YEN goes Gold goes…..
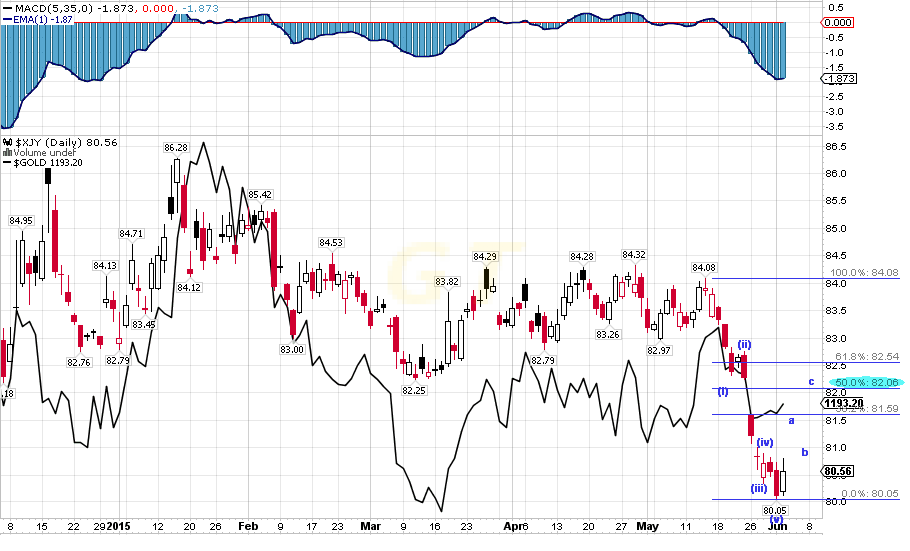
YEN Chart looks bullish for gold BUT THE MINERS….
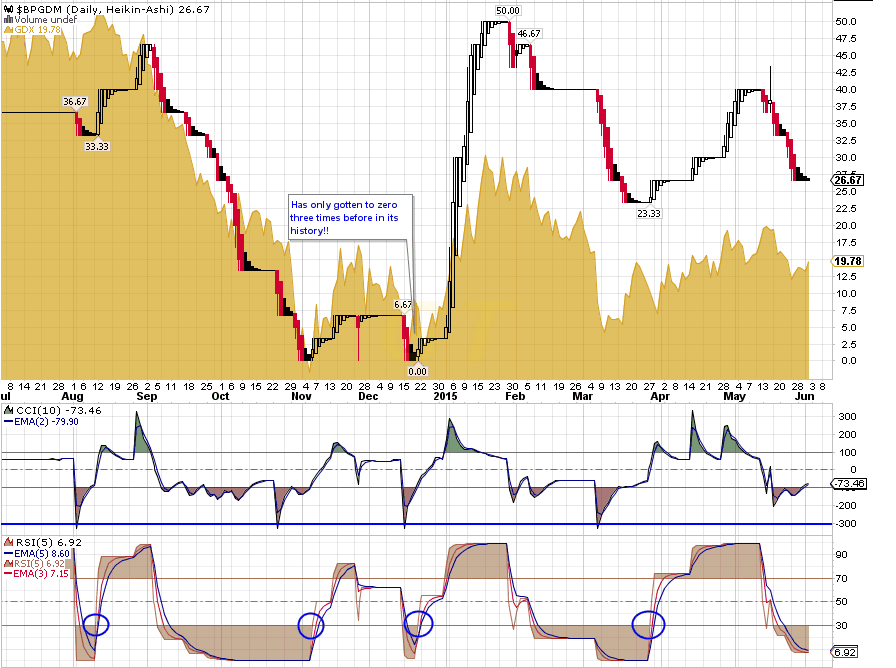
Gold Miners Bullish Percent has some more work to do (blue circles on RSI(5))….
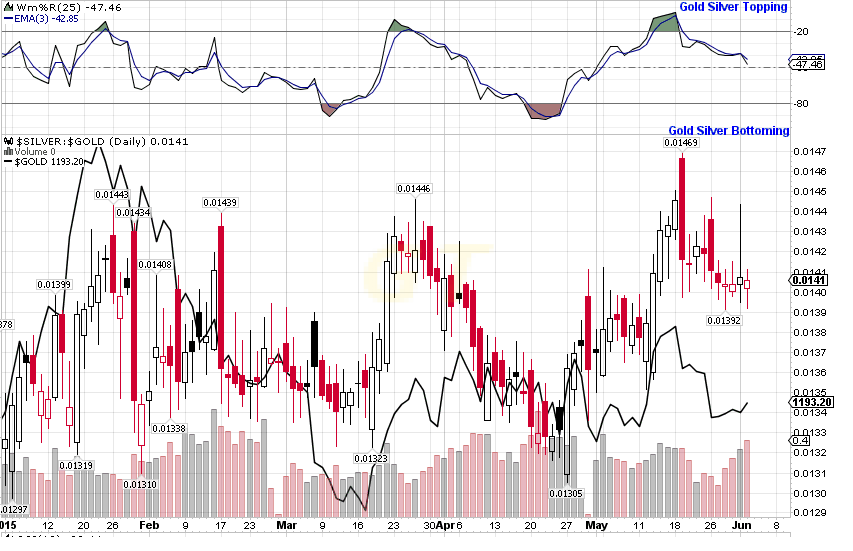
Silver: Gold Ratio Chart (also called Clive Maude’s Peak Indicator Chart) needs some more work (Note the Wm%R(25))….
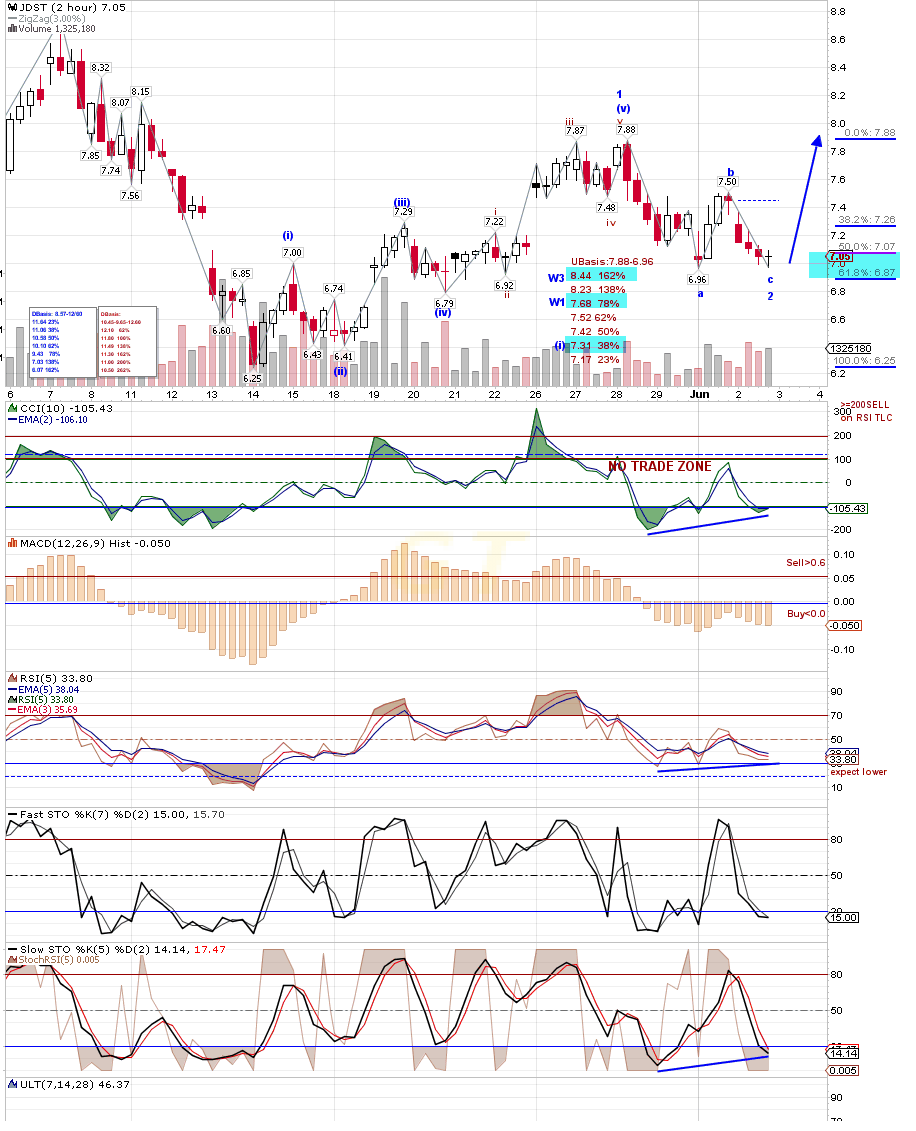
JDST 2HR almost fired off a buy today. Need RSI(5) and SlowSTO Trigger Line crosses to confirm…
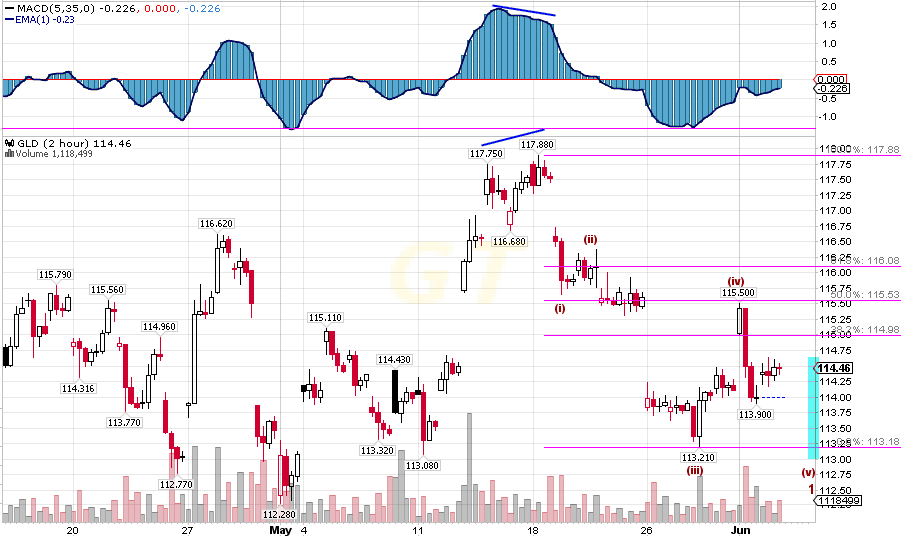
A slightly different way of counting the GLD 2HR Chart (???) actually makes the EWO happy 🙂 … at least one more lower low …. (Note on this chart how the ULTimate Oscillator is pointing down… this is a leading indicator)
In Summary, I’m not confused… YEN implies Gold is going up…. Miners have more downside per Bullish Percent (Maybe $SPX is going to break down??)…. Clive, I mean Gold-Silver Ratio Chart, says we need more downside in Gold… JDST looks to be wanting to start a Wave 3 Up… and the GLD Chart says we have some more downside to go…. Let’s throw the YEN Chart out and be HAPPY BEARS!!!