Rambus Chartology Meets Catherine Austin Fits :
CAF is one of the best interviewers ( and interviewees ) out there on the www
Her Question and Answer Session with Dave (Rambus) will shed a lot of light on the what, the where, the why and the how, of Chartology : So I post it here for all new (and experienced) TA Affectionados
Catherine’s Website is www.solari.com
…………………………….
THE INTERVIEW :
Why Rambus?
CAF: Rambus, your industry handle has been Rambus ever since you started your remarkable website – Rambus Chartology. I love the story of how you got your handle and how you financed your home! Please do share it with our subscribers!
Rambus: Actually Rambus was a chip stock I traded back in the 1990’s tech bubble. There were a lot of new technology stocks that were being born back then such as Amazon, E Bay and Cisco just to name a few. Rambus was one of the most volatile stocks at that time and would go up and split only to go up and split again. They were in the semiconductor area that was really hot and supposedly had a patent on a particular chip that was going to make them a fortune.
The last time I traded Rambus was during the first part of 2000 when the tech bubble was peaking out. It was over $200 a share as were many tech stocks back then. The last time it split was a four for one stock split which meant I now had four times as many shares as before. It started trading in the low 50’s but what happened next was what every trader dreams of.
Within the next two months Rambus was already trading back up to about the 135 area when I called my broker telling him to put a sell/stop in at 123 just in case it was running out of gas. I was also watching a chart on the COMPQ that was suggesting that it was time for a pause at a minimum or maybe even a top of some kind may start forming. A couple of weeks later my sell/stop was hit at 123 and the rest they say is history.
That was a life changing trade for me that basically let me retire in my late forties. I still remember asking my wife if she was ready to build our dream house on our forty acres and she said, I’m paraphrasing here, “are you kidding me?” I said “nope.” Six months later we moved into our brand new house complete with all new furnishings. That is the reason I use Rambus as my handle as it was very good to me.
…………………………………………………..
How Rambus Chartology Got Started
CAF: One of the things that you and I have in common is that we were both booted out of Goldbug USA. So tell us how you offended the Goldbugs and came to start Rambus Chartology. I would appreciate it if you would describe in detail what your charts were telling you at that time.
Rambus: After trading the greatest bull market in history it was hard finding new stocks to trade as most of the tech stocks crashed and burned during the ensuing bear market. I remember it was in the spring of 2002 when I stumbled upon the bull market in the precious metals complex. Up to that point I didn’t know a junior precious metals stock from a big cap precious metals stock as they were so far off my radar screen. One day I came across a long term weekly chart for gold which was showing a big and beautiful inverse H&S bottom forming which got my attention.
From that point on I started studying and reading everything I could on the precious metals complex. I learned there were many juniors that could have big moves when the time was right which was right up my alley. I had found a new bull market to trade.
Back in 2006 I found a free primary gold website where posters were expressing their ideas on gold, silver and the precious metals stocks. I followed their posts for a couple of months before I decided to post my first chart which I still remember was a very long term monthly chart for silver which was very bullish at the time.
I got a few comments and started posting fairly regularly. I met a poster there by the handle of Fullgoldcrown who was probably the biggest goldbug I had ever know up to that point. He would often compliment my charts because they were always very bullish on the precious metals sector so we formed an online friendship.
As that website was a gold only website you couldn’t post charts on the stock markets or anything else if it didn’t pertain to the precious metals complex. If you did post on something other than the PM complex you would find your post deleted.
About 25 or 30 members decided to go out on their own and start a free-gold website called Goldtent / Posters Paradise. This new free website was much more open to the stock markets and other techniques of trading. They asked me if I would like to join and I said yes because I was always open to new ideas of trading as there are many different methods to trade the markets.
Everything was good until I started noticing a potential H&S top that was forming on the HUI back in 2007. Keep in mind the bull market in the precious metals complex was going full throttle to the upside at that time. When I started posting the possibility of an H&S top forming I started getting a lot of negative feedback (to put it lightly).
Fullgoldcrown, who I considered my friend, could not believe I would post something negative about gold and silver. So at that point I decided to just back off and do just an occasional post because I knew most of the members were staunch goldbugs and they didn’t want to hear what the charts may be showing.
As it turned out, that H&S top did play out and the HUI dropped from 520 to 150 in a matter of about five months. The precious metals stocks crashed beyond anyone’s comprehension when it was all said and done. From that point I just kept to myself and pretty much just did my own thing.
A couple of times Fullgoldcrown would send me an email asking if I would be interested in starting a new website and I politely declined because I knew it would take 110% of my time and I was happy just the way things were.
Then in 2011 my father passed away unexpectedly and I missed our conversations and discussions we had on the stock markets and the economy. Even though we rarely agreed on the markets, I missed having someone to really talk about where the stock markets might go or what shape the economy was in.
So in July of 2011, I e-mailed Fullgoldcrown to see if his offer still stood on wanting to start a new website. He said “yes, let’s do this.” He said he knew a computer wizard named Todd that could build the website from scratch but he needed a couple of months to work on the design. In October of 2011, Rambus Chartology was born. We had no expectations on what would happen when we opened the door but here its four years later and our door is still open.
…………………………………………………………
What Rambus Chartology Does
CAF: Give us an overview of what a public viewer will find at Rambus Chartology and the resources available to subscribers. You have built up quite a community. Perhaps you could say a few words about your partners and the subscribers who are contributors to the ongoing discussion.
Rambus: If you’re interested in charts, we have a ton of charts ranging from the stock markets to the precious metals complex, currencies or just about anything that can be charted—we have it. We also have a forum where you can post your ideas on any market or trading discipline that you use. Everyone is shown respect even if you’re a novice which many of our members are.
We also have many members that are very good at trading the markets and post their views at the Chartology Forum. We have folks that are into cycles, Elliot Wave , Gann theory ,Channels , Forks, Indicators and just about any trading discipline you can think of. There are members from all walks of life and from all over the world which I didn’t expect when we opened up our website at Rambus Chartology. The world wide web has really opened up the door for the little guy. It is personally very rewarding for me to read the Chartology Forum every evening and see the comraderie and original work presented in the all for one , one for all, spirit that is the theme for this roundtable .
We have many free public posts where you can come in and look around and decide for yourself if our website suits your needs. These are also Chronicled at Gold-Eagle . https://www.gold-eagle.com/authors/rambus
Fullgoldcrown came up with a motto that reads, “give a man a chart and he may prosper for a day, but teach him to chart and he will prosper for a lifetime.”
Behind the scenes we have Fullgoldcrown who is our public relations guy that will help you get on the site if you’re having problems, set you up with a password or anything else if you need help.
Audept is our computer wizard that built our website from scratch writing his own code. He’s one of those guys that you don’t hear much about but you know he’s working behind the scenes taking care of business.
………………………………………………………
About Technical Analysis
CAF: Before we dive into what the charts are saying now, give us some background on how you developed your gift with technical analysis and why you think it is important. Any tips to beginners on how they can begin to educate themselves?
Rambus: I first became interested in the stock market way back in 1974 when I returned home from overseas. My father who grew up during the great depression was always very conservative with his money and had opened up a trading account with Merill Lynch. I was shocked to say the least. While I was overseas there was the infamous oil embargo that I missed.
My father, using basically a fundamental approach to the stock market, bought American Motors because he thought everyone was going to buy smaller cars based on the price of oil. I remember he bought American Motors around 12 or 13 dollars a share. From the point at which he bought American Motors the stock just kept going down lower and lower until he lost over half of his investment. American Motors eventually went bankrupt I believe and the stock never got back up to where my father originally bought in. That was his one and only time he ever invested in the stock market.
By all rights, what happened to my father should have steered me away from the stock markets but it had just the opposite affect on me. I could see way back then the potential the markets could have on someone either good or bad.
I knew absolutely nothing about the markets so I began the education phase of learning as much as I could on how the stock markets worked. I bought my first book on the stock market and the author’s trading system was based on watching the ticker tape looking for big blocks of shares that would show him if a stock was under accumulation or distribution. That’s the way most of the short-term traders did it back then: watching the ticker tape.
I didn’t really get much out of his trading system but his book had some charts in it that really fascinated me. I began to look for books with charts in them and I stumbled across a book by Edwards & McGee on Technical Analysis of Stock Trends. For me, personally, that book just made sense.
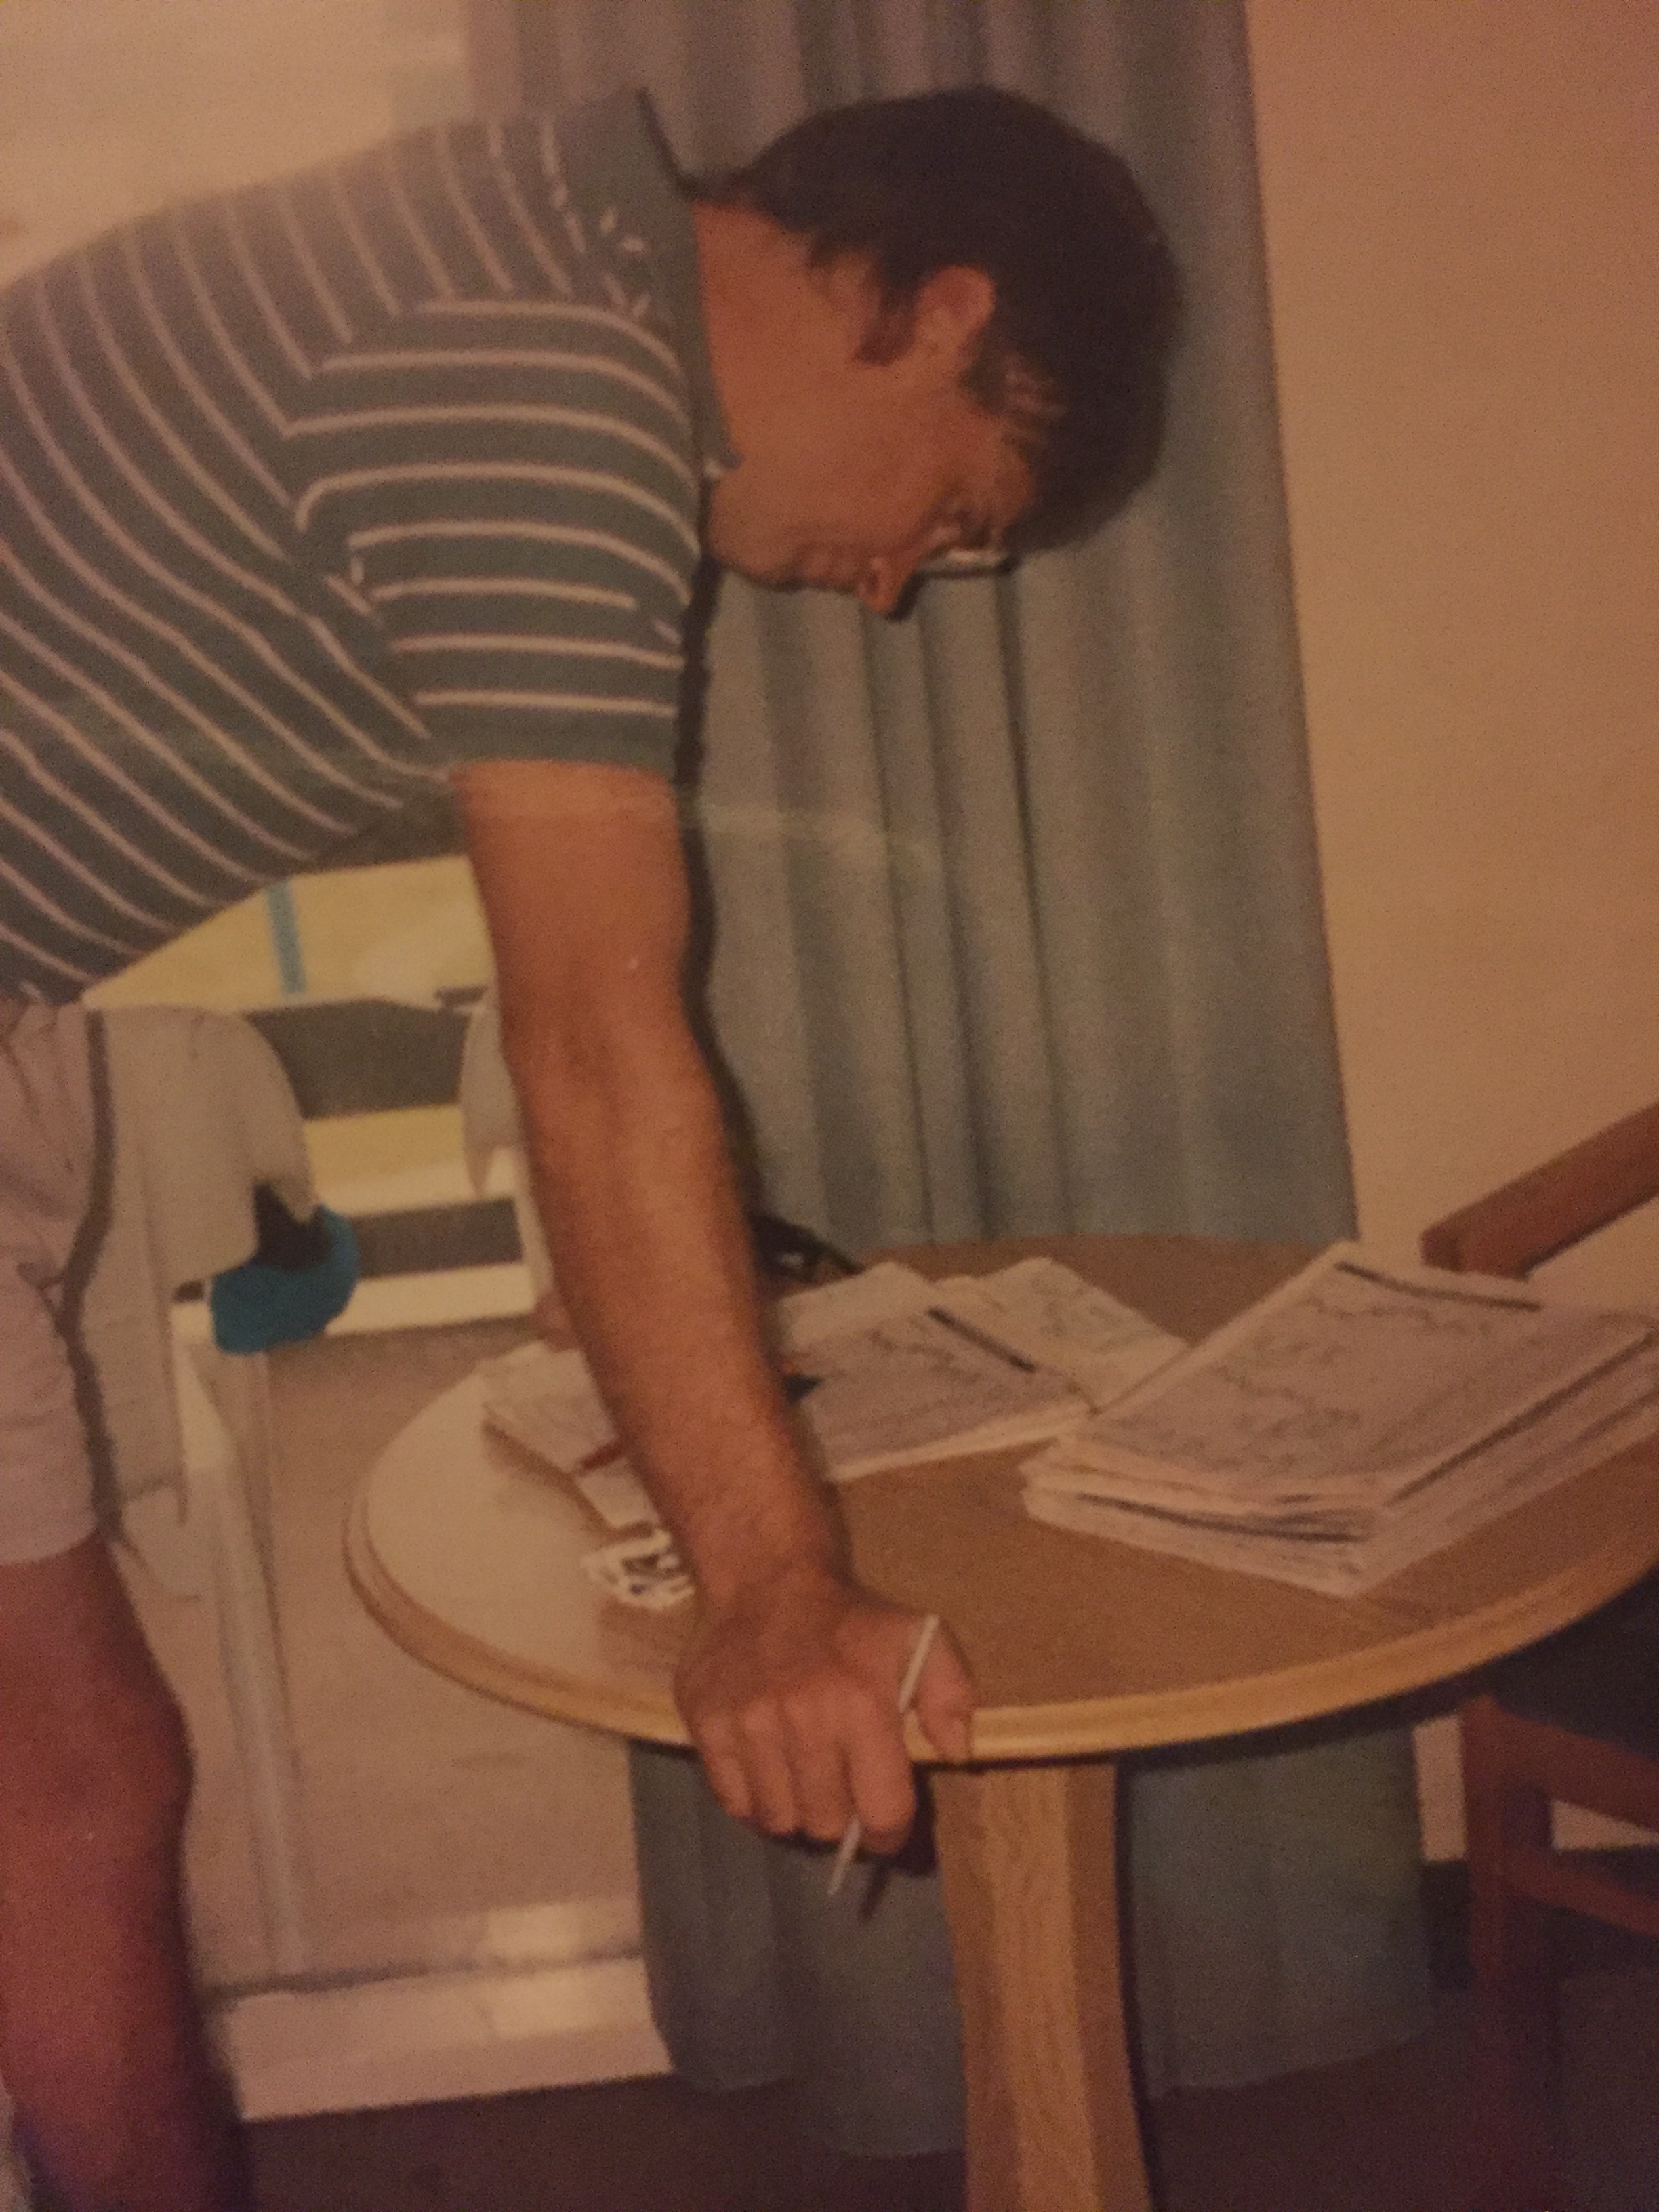
Back in those days charts were very hard to come by so I decided to start making my own charts. I was one of those guys with a sheet of graph paper, a pencil and a ruler. I would put five bars to a square which would equal one week’s worth of price action. I charted 100 stocks a day using the quotes from the Wall Street Journal. It took me about an hour and a half a day to chart those 100 stocks. It was labor-intensive compared to what we have now.
Here is a photo my wife took while were in a motel by the beach back in the day
When the 1990’s arrived so did a lot of different technologies and especially charting services. Technology really opened up the door for the little guy. Prices were no longer delayed by 20 minutes. Real time quotes became a reality and they also stopped using fractions and went to decimals.
The very first charting service I subscribed to required a six-foot satellite dish to get real-time quotes and charts. My computer was running DOS back then which seems like an eternity ago.
With that satellite dish I could now get monthly, weekly, daily and minute charts with one click of a button. I thought I had died and gone to heaven. That was a real breakthrough in charting for me. I could start looking for all the different chart patterns, on different time-frames, that I had been studying for so many years in what seemed like slow motion compared to my new 1990’s high-tech satellite dish. From that point on, charting really took off for me and I couldn’t think of any other trading discipline I wanted to learn and understand more than looking for patterns on a chart.
…………………………………………………………
Tracking the Markets
CAF: Let’s first review the indicators you look at to track the markets and why you use them.
Rambus: First and foremost, I look for chart patterns. When I think I may have found something that looks promising I will look at just a handful of indicators such as the RSI, MACD and stochastics just to give me a feel if the stock may be overbought or oversold. Using too many different indicators can get a bit confusing and cloud one’s thinking. Most technicians generally have their own set of favorite indicators they like to use based on how they interpret the markets. It’s really a personal thing and what you get comfortable with.
I also like to look at several different moving averages as they can tell you a lot about a trend. The 20-day ema and the 50-day ema (exponential moving averages) are my two favorite moving averages to look at from a short to intermediate-term perspective. Many times when they cross they will give you a buy or sell signal.
On the weekly charts, the 30-week ema does a good job of showing you the intermediate to longer-term trend. Then there is the old standby, the 200-day moving average, which shows the very long-term trend for a bull or bear market. There is only one rule when it comes to the markets and that is: there are no rules. The sooner one learns this rule, the better off they’ll be.
……………………………………………………….
Chartology ??
CAF: What does the word Chartology mean?
Rambus: Chartology is a new word coined by our computer guy, Todd. The word Chartology is a combination of two disciplines. “Chart” of course implies the study of chart patterns and “ology” is the study of the psychology of investors who make up these chart patterns. It’s the thousands of investors, all acting in concert, bulls and bears alike, that create the many different chart patterns we look for on a chart.
Human nature and the sum total of all trading activity tends to repeat over and over again throughout time. Once you learn to read a chart you will be able to see the battles that take place between the bulls and the bears on any given time-frame from minute charts to long-term monthly charts. This will give you an edge in deciding if you want to make a trade or not. So basically, we’re charting the psychology of thousands of investors interested in a particular stock or market.
…………………………………………
CAF : Thank You so much Rambus for taking the time to enlighten Solari readers on this fascinating subject .
I know many will want to learn more about this brand of Technical Analysis .
Where can readers find you on the net .
Rambus : we are www.rambus1.com
It was a great pleasure connecting with You and your community Catherine . My partners and I are also great fans of your work. Look forward to chatting with you again.
All the best
Rambus