Gold- Estimating the Price top
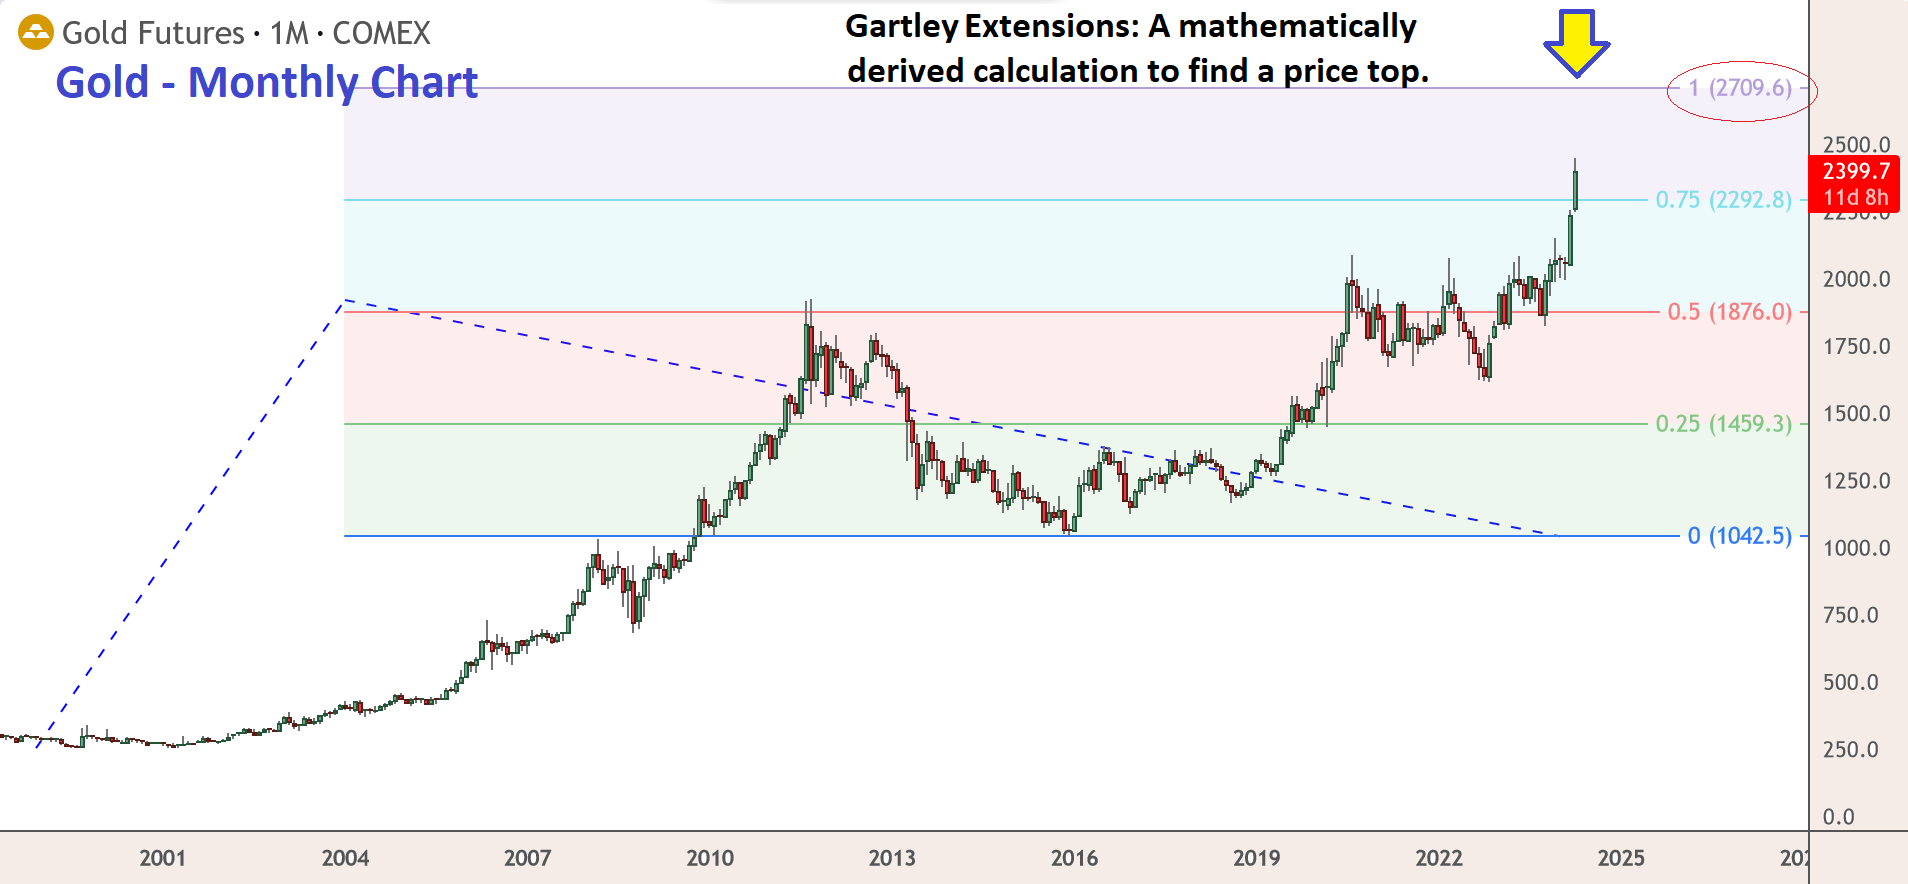
Lets put up one more gold chart. This time I have a current candle chart of gold. Its a 25 year view using monthly price bars and we are using Gartley Extensions to try and derive where the price will top-out based on price history to date. This is a well used formula and the method has been validated by technical people everywhere with productive results. Sometimes, the target prices are hit within pennies of the estimates. So the validity of the method is not in question although its fair to say there are times when the actual price overshoots and other times when it fails to reach the target highs.
So here you have gold and it is evident that the target line is at 2709.60 which means we are currently within just 309 dollars of the final top on this cycle before price turns around and corrects. You may argue with this method all day long and come up with any excuse why it will be wrong. But it will beat you almost every time.
Gold is nearing a major 25 year top. It is going to break down once it gets there unless it can decisively breech that 2709 line and prove its going higher. It can do so by posting a monthly candle with both the opening and closing price above the line. Lets see what happens next. In the meantime, I will warn you once more that you are just gambling by trying to speculate on prices exceeding the target on a long term basis.
But do as you please. Its no care of mine what you do with your own money!
Thanks for sharing your work, Farmer. Much appreciated
You are very welcome Silverboom. I have been a technician for many years now and have learned a great deal about price behavior. In the last three days I have posted 6 technical charts that support the same viewpoint and can be fairly well relied upon to guide our near term decision making.
They are not the final word though. The last word will go to gold itself and the mood of the market. But I did want to point out to our group that I had legitimate concerns about the excessive bullishness regarding gold and I wanted to bring it to everyones attention so we may get an early heads up avoid any ugly surprise if gold abruptly drops. I did not mean to upset the room though. Just offer some objectivity.
Hopefully I have been of service to you this week.
Good to know.
No way I am dumping my actual bullion at $2700. It could go to $300 and I wouldn’t care. It was never meant to get rich off of.
But for anyone actually using leverage or the miners, that number is good to know. Needless to say, if the LT cycle does ultimately top at $2700, that will be beyond disappointing for anyone who has waited for gold’s moment in the sun for the last 12 years.
For the record Nautilus, I can tell you gold will go higher and even exceed 3000 dollars. I cannot however show you those charts as they are a closely held secret. My warning still stands though. Just be cautious.
I am not going to make any predictions how this plays out. All I am going to do is ask, have my own personal financial goals been reached. If I can answer yes, then I will start cutting my positions massively.
Bullion–the real purchasing power would need to become historically extreme before I traded it in for USD. We are talking dow:gold of 2 or less.
Sure, an 85% decline in the DOW is all it would take and you will have your ratio. Its certainly possible. Maybe even likely. Once gold hits its top it will consolidate for months around the highs before turning down in 2025. so this will be happening slowly. You will see it coming.
Farmer Farmer Farmer — the “tent” is your friend and there can be no secrets amongst friends – right!
So don’t be shy — share share share those closely held secrets — we promise we won’t tell!
lol….sure you won’t…..chuckle
I would be curious to see what the Gartley price extension was projected to be for TSLA in December 2019 (or shortly thereafter, i.e., when it technically “broke out” from the 2-3 year base it had built).
That model could not have been used in that case. But I can tell you Tesla is now heading to zero. So avoid it.