Combining Two Methods to Calculate a Gold Move.
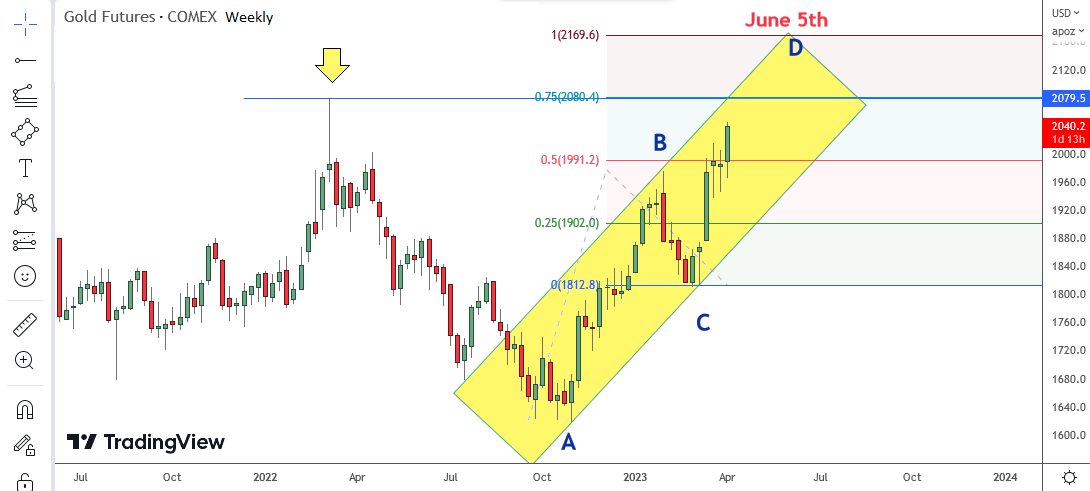
My own way of looking at gold shows its exceptional bullish features for the next two months. What I have done here is identify an obvious rising channel and then superimposed that on a Gartley ABCD calculation. The Gartley works by calculating the A-B leg as being equal to the C-D leg and when we view it in that formation the strength of this move is clear.
Note for example how the line identified as the 75% line is precisely at the same level as the prior peak from March 2022. I love how that looks. Even better though is that the implication is for gold to soar over the top and reach a height of 2169.60 (so its very, very close to your 2200 dollar gold call, Fully!). I am in agreement with you obviously.
This chart has a target date of June 5th 2023 (two months hence) based on the merging of the channel with the Gartley numbers “D” target line. Its my own unique way of estimating price moves and direction. It works quite well sometimes but there is some obvious wriggle room in how the chart gets drawn. So its not exactly science but it often gets us closer to a good understanding of the chart dynamics. Sometimes I need to squint to make these work but in todays example it looks pretty solid.
In case its not crystal clear to the reader, what I am actually doing here is estimating “the time to the destination price”. So I am interested in price of course but even more importantly, I want a better idea of WHEN price will reach its target. Just a word to the wise, Gartleys are notorious about reversing right at the 75% line.
I suspect this has something to do with the point at which the market finally catches on that a bull trade is happening and buying reaches a point whereby selling is actually a better option. So take care not to buy the 75% line unless it is decisively breached to the upside. Instead, let it pullback as it will most likely do and then be prepared to buy the reflexive low.
Odds now favour the Goldbugs.
Good work, Farmer. Have not seen this approach before – very intriguing.
Always good to have another piece to the enigma of gold price movements. In the past, I’ve always been burned – and badly – because I simply held, held, held. Until my gains turned into losses. A road map like this helps overcome the curse of FOMO and triggers an “I’m gonna take some profits and let the gamblers try to get the last inch of the move up.” Overcoming emotions is so dang important, and an objective tool/perspective like this is most helpful.
Nice Sir Farmer
I never understood these Gartley thingys
Thanks guys! I really appreciate the positive feedback. I have been using this approach for years. It tends to keep me on the right side of a trade but it does have some drawbacks. While it looks like a logical approach its more what I would call sciency or science-like. Things happen that are never in the formula. Price might drop below the channel for example forcing you too sell. And then the channel angle will widen and change as a result or the trade will suddenly move sideways until you feel crazy. But as a generalist tool its certainly got merit. Especially on short time frames like the 5 minutes and one minute charts.
If Gartley patterns interest you Silverboom then you should follow it up more as its well worth learning. He was ahead of his time with some of the amazing chart methods he came up with. This one is based around dividing the pattern into quarters. The center line is the 50% mean reversion line naturally. It is surprisingly accurate sometimes. Even shockingly accurate at hitting targets. So much so that you can get mesmerized and lost in the chart at which point it will do something unexpected that costs you a pile of money! LOLOLOLOL
Just saying….its a handy tool but like all tools you have to respect the unknown variable that always enters the scene from stage left and screws up an otherwise perfect looking setup.
Just an added follow up Silverboom. This method is new for you but let me assure you its old as the hills. I learned it from an experienced trader named Rick Ackerman about twenty years ago and he has been teaching the system for closer to 40 years if I am not mistaken. Since you seem interested I will offer Ricks site address and you can check it out. There is nothing in it for me. This is just a memo to you that if you want more there is still an active course being offered. I think Rick must be getting up there in age though. No doubt he still has plenty of energy.
Ricks Picks Website
https://www.rickackerman.com/