DUST_follow-up
Below chart for DUST (2x GDX-decline). Both close-up and 9 months overview. so far the BLACK FORK is holding as taken from April-22 low and gives us 2nd touch on the fork as for calibration (of the fork). GREEN CYCLES gives the projectory while the DASHED ARROWS potential roadmap.
As seen on the DUST-close-up: yesterday was BO (break-out) for DUST on the Nov-22 downtrend (see little purple line) while today possibly its’ BT (back-test).
As Pedro Deleon uses multi layered indicators while following price, I prefer to apply the concept of TIME using (charted) CYCLES and alike. I like to create PREDICTIONS CHARTS giving change to Probability. Each its’ own. And I confirm that different chartists and analist can come to a same conclusion while applying different technique. Nevertheless, all is connected and one should take other spectrum in consideration. In this era moreover watching currencies giving the bigger picture from where indices (like GDX) can be mind-plotted.
IMO
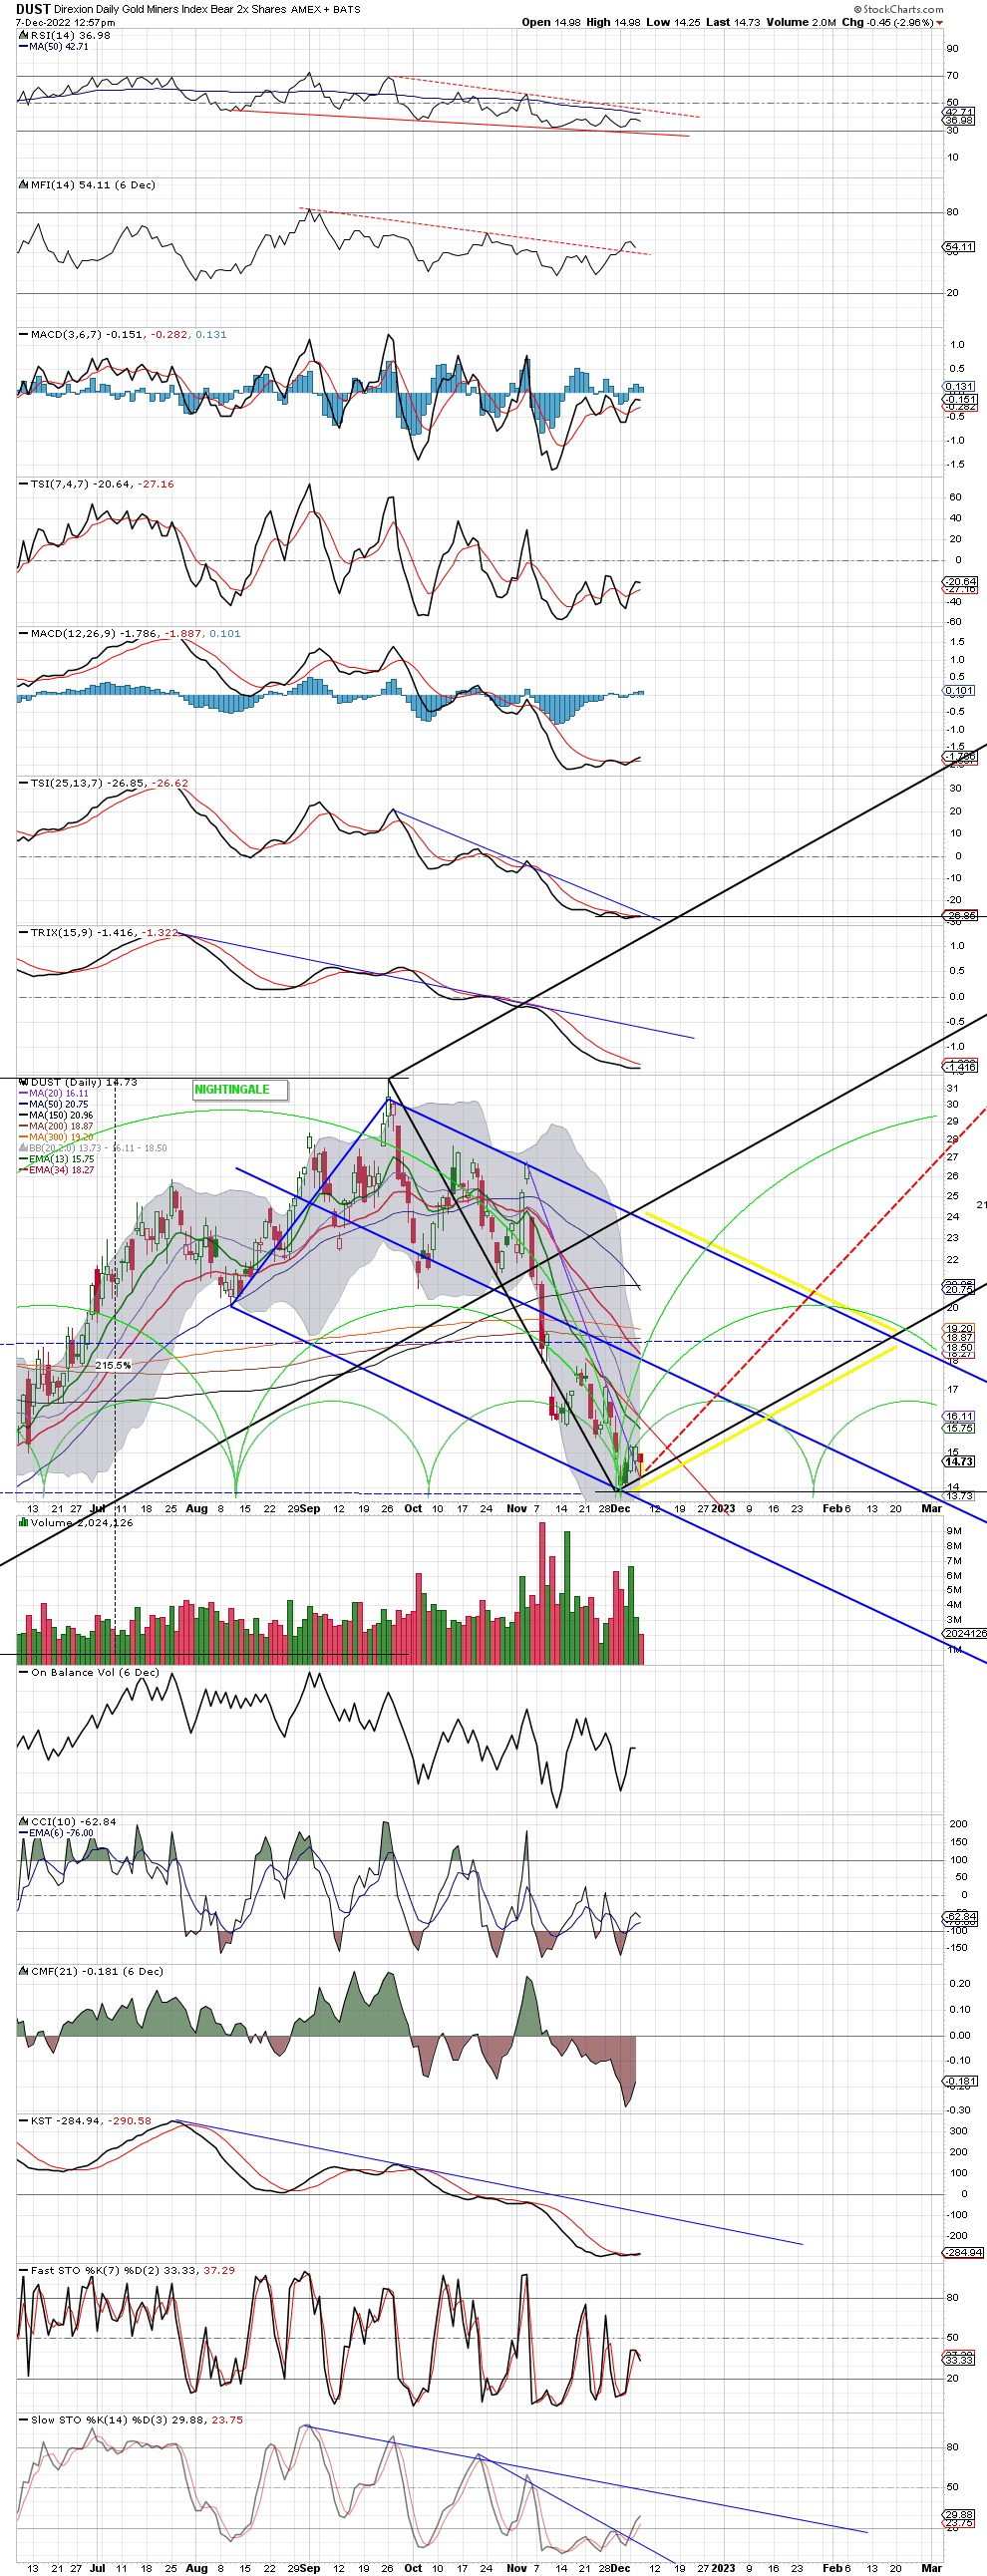
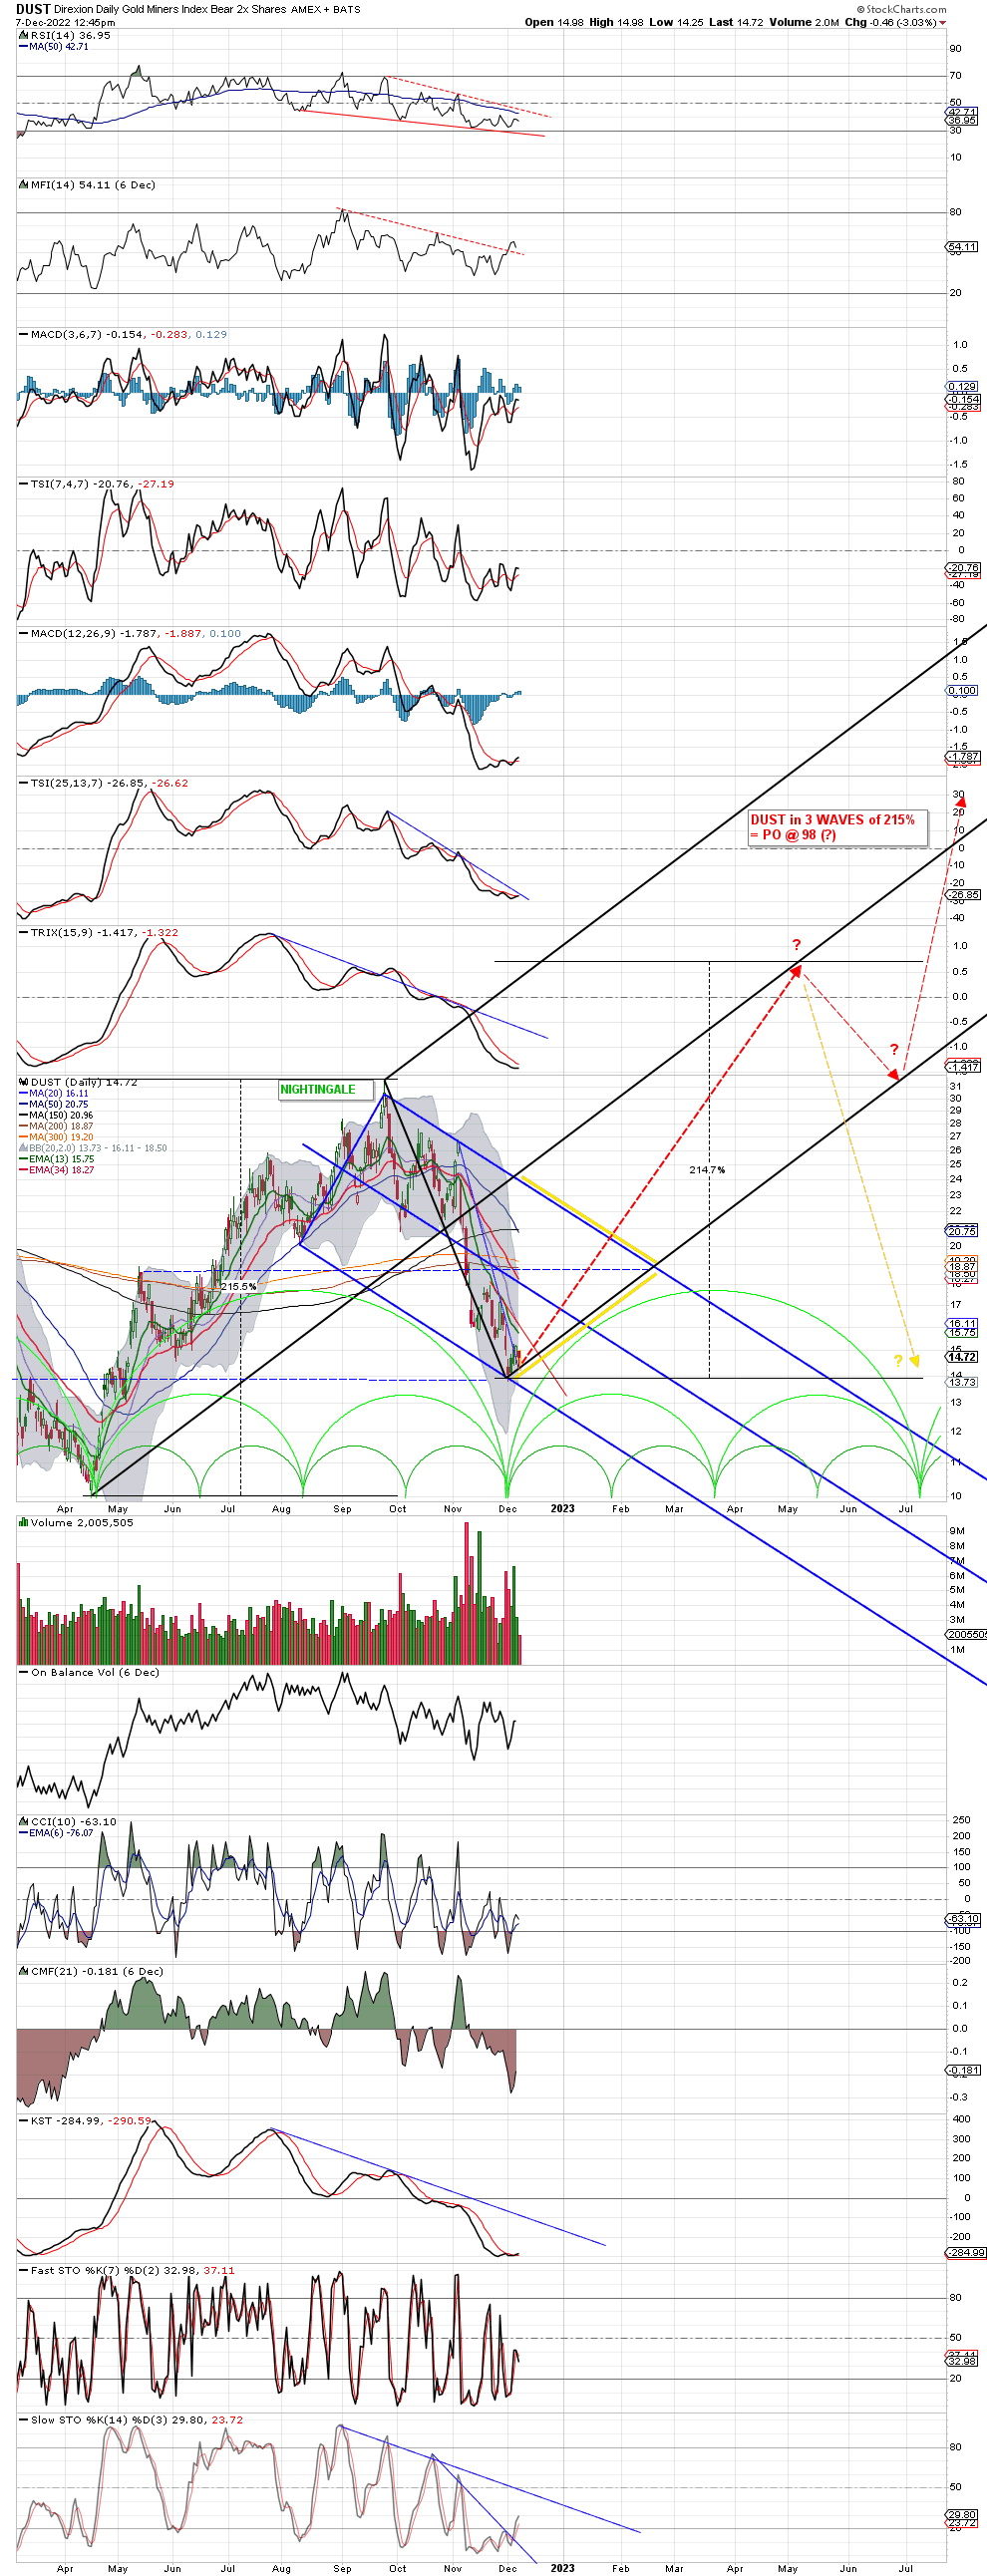
corrected the double posted chart – now close up + 9 month chart for DUSTY
“Pedro Deleon uses multi layered indicators while following price”
Not quite accurate there, Nightingale.
Its pedro deleon, to be more precise. No caps.
And its multiple indicators following price AND volume.
Volume is the missing link for many. (As you would say for Time.)
The layering part pertains to time frames, not the indicators.
(Multiple layers — like pdf construction except my layers feed into each other, like ink bleeding through the layers. The layers ‘talk’ to each other, mostly from higher time frames down to lower.)
As for GDX and DUST/GDXD, I’m still waiting for confirmations and volume is likely the key factor going forward. The entire Risk Off play remains in suspension pending SOMETHING, yes likely somewhere in FX land.
good for clarification. And certainly no confirmations yet. I have a cycle chart GDX-weekly chart which gives odds for both bulls and bears. So we just await.
Rambus just bought NUGT
For clarification … I am not trading DUST. I am just happy charting. All those ETFs are H*rseshit and in general a losing game. I only look at DUST/NUGT to confirm what I see in GDX. So far GDX (monthly) as presented before is still in progress of creating long term right shoulder while BT-ing the HEAD from below which (as mentioned) could take several months before done. Bull/Bear fight. IMO