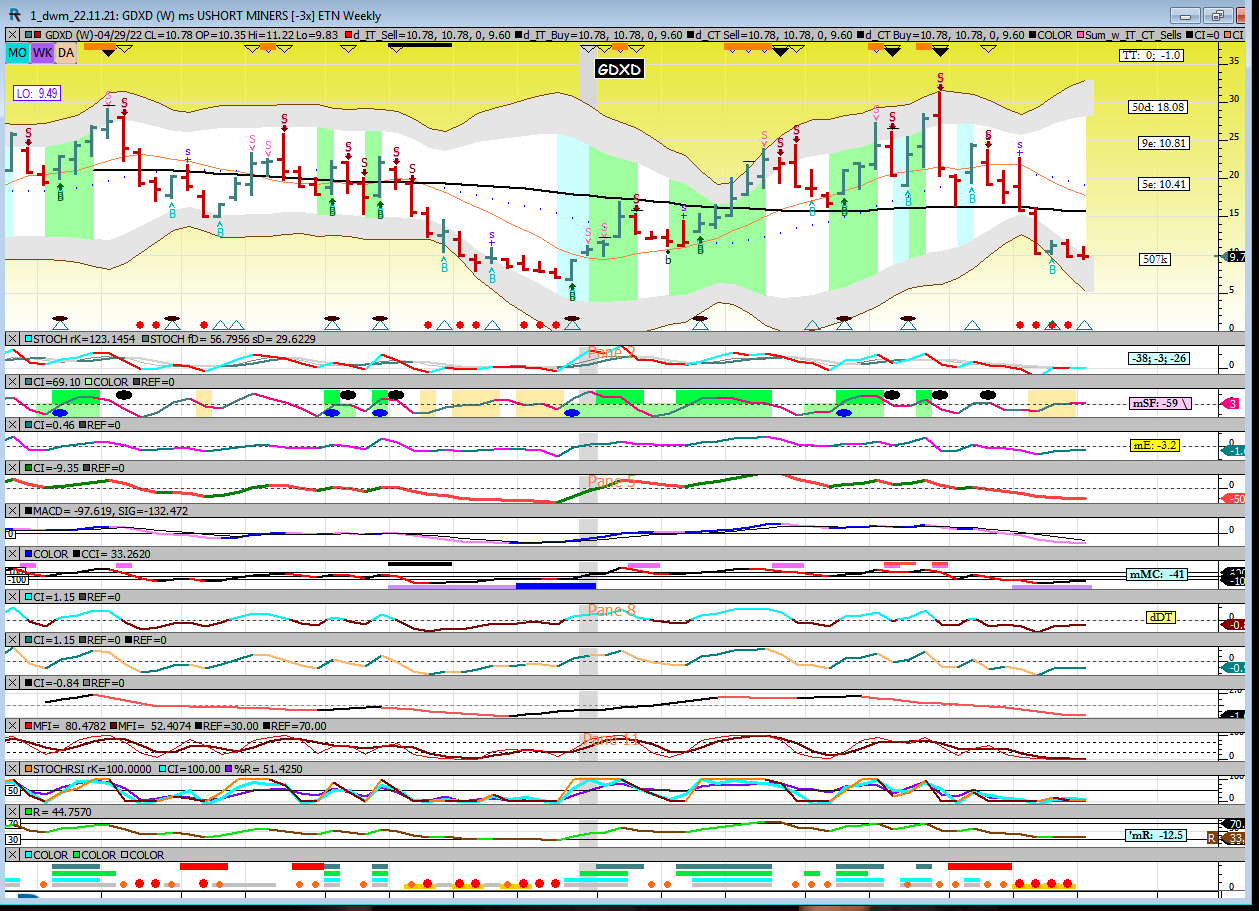
GDXD weekly
Posting “a chart”
Still waiting for a confirmed Risk Off move of some kind, per the $ charts finding support at 200dma. Maybe.
I’m tracking about 30 different ways of playing it when it comes.
This is ONE layer of a 4D chart, but its my preferred birds eye view, a weekly.
Key for me is BACKTESTED signals. They generate REPUTATION for them. Nothing is ever SURE FIRE.
I will not respond to questions regarding the methodology. But I will supply reading cues.
Shading of bands (blue or green) is constructive. Necessary in fact.
So are darker B(uy) signals and certain ovals in lower panes for buy and sell.
One other note. “From the monthly” the text boxes on the right in panes 2 and 3 at -38 and -59 suggest the weekly move when it comes will be COUNTER TREND, as positive numbers are needed to flip this to a long term bull chart.
When that happens, the dark blue marker on pane 7 appears.
As it did last April (sorry the months aren’t showing up.)
Before the blue marker, the purple marker in Feb and Mar warned it was coming.
Just like its doing now.
You have incredibly detailed charts pedro…in 4 dimensions no less
I still cant interpret them . Thanks for the tutorial