Gold: View from a Friend
From my semi-retired friend who’s been a professional technical analyst at several firms since the early 1970s. He shared this with me today.
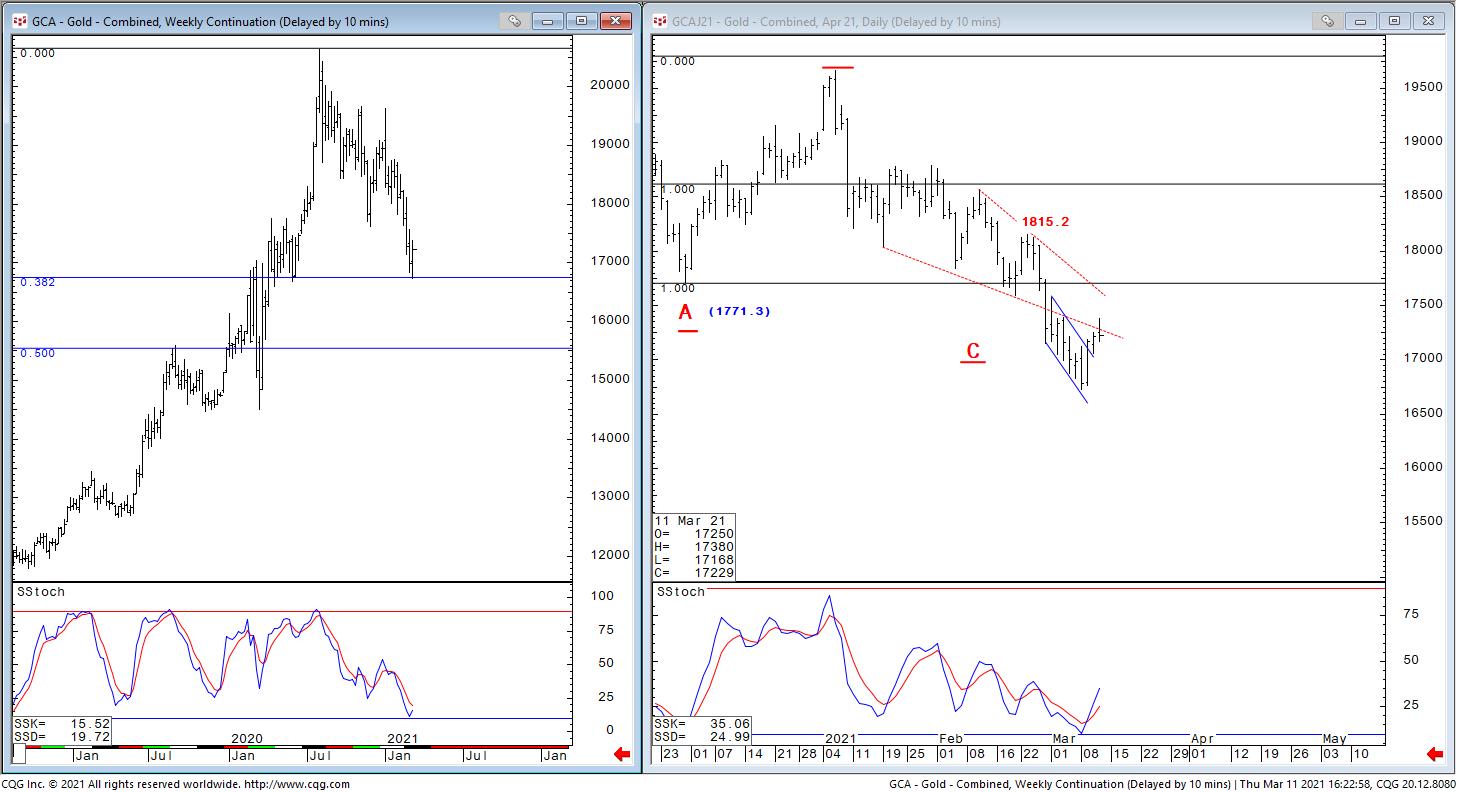
Gold: Weekly and Daily April 2021
Support 1660 plus/minus. Resistance reset to 1771.30 closing basis. Prices on the daily chart have been able to close above the down flag. Down flags in down markets are often reversal patterns thus the upside exit basis the close is the first step in considering a low in place. The second step would be closing back up inside the red lined diagonal triangle.
Readers may recall our relating the “throw-over” which usually occurs in a rising diagonal at the end of a bull run. When prices end their short period of extreme strength and re-enter the pattern on the downside, it leaves a high in place. This situation in the gold is the inverse. A 3rd item is a close above 1771.30 (at A), which we will simply consider a former breakdown point. The final confirmation will be a close over the former upper boundary of the diagonal. It sounds like lot of work but it’s not. The pattern’s lower boundary is at hand, and at this current point in time the 1771.30 (A) level and the diagonal’s upper boundary are just about at the same level.
A close above 1771.30 would accomplish all of the foregoing.
so….we continue to establish a bottom – waiting is never fun
Excellent Gold roadmap…thanks Boo
Hat tip, BooBooMan!