$HUI Weekly
Have been sitting on this chart for a few weeks – was reluctant to post as the implications seem wretchedly bearish. The top and bottom rails are parallel. Point “1” on the chart is at the bottom for Gold and the miners way back in the opening days of January 2016. Today $HUI closed below its neckline. Its Tuesday, so there is plenty of time this week for $HUI to make a recovery.
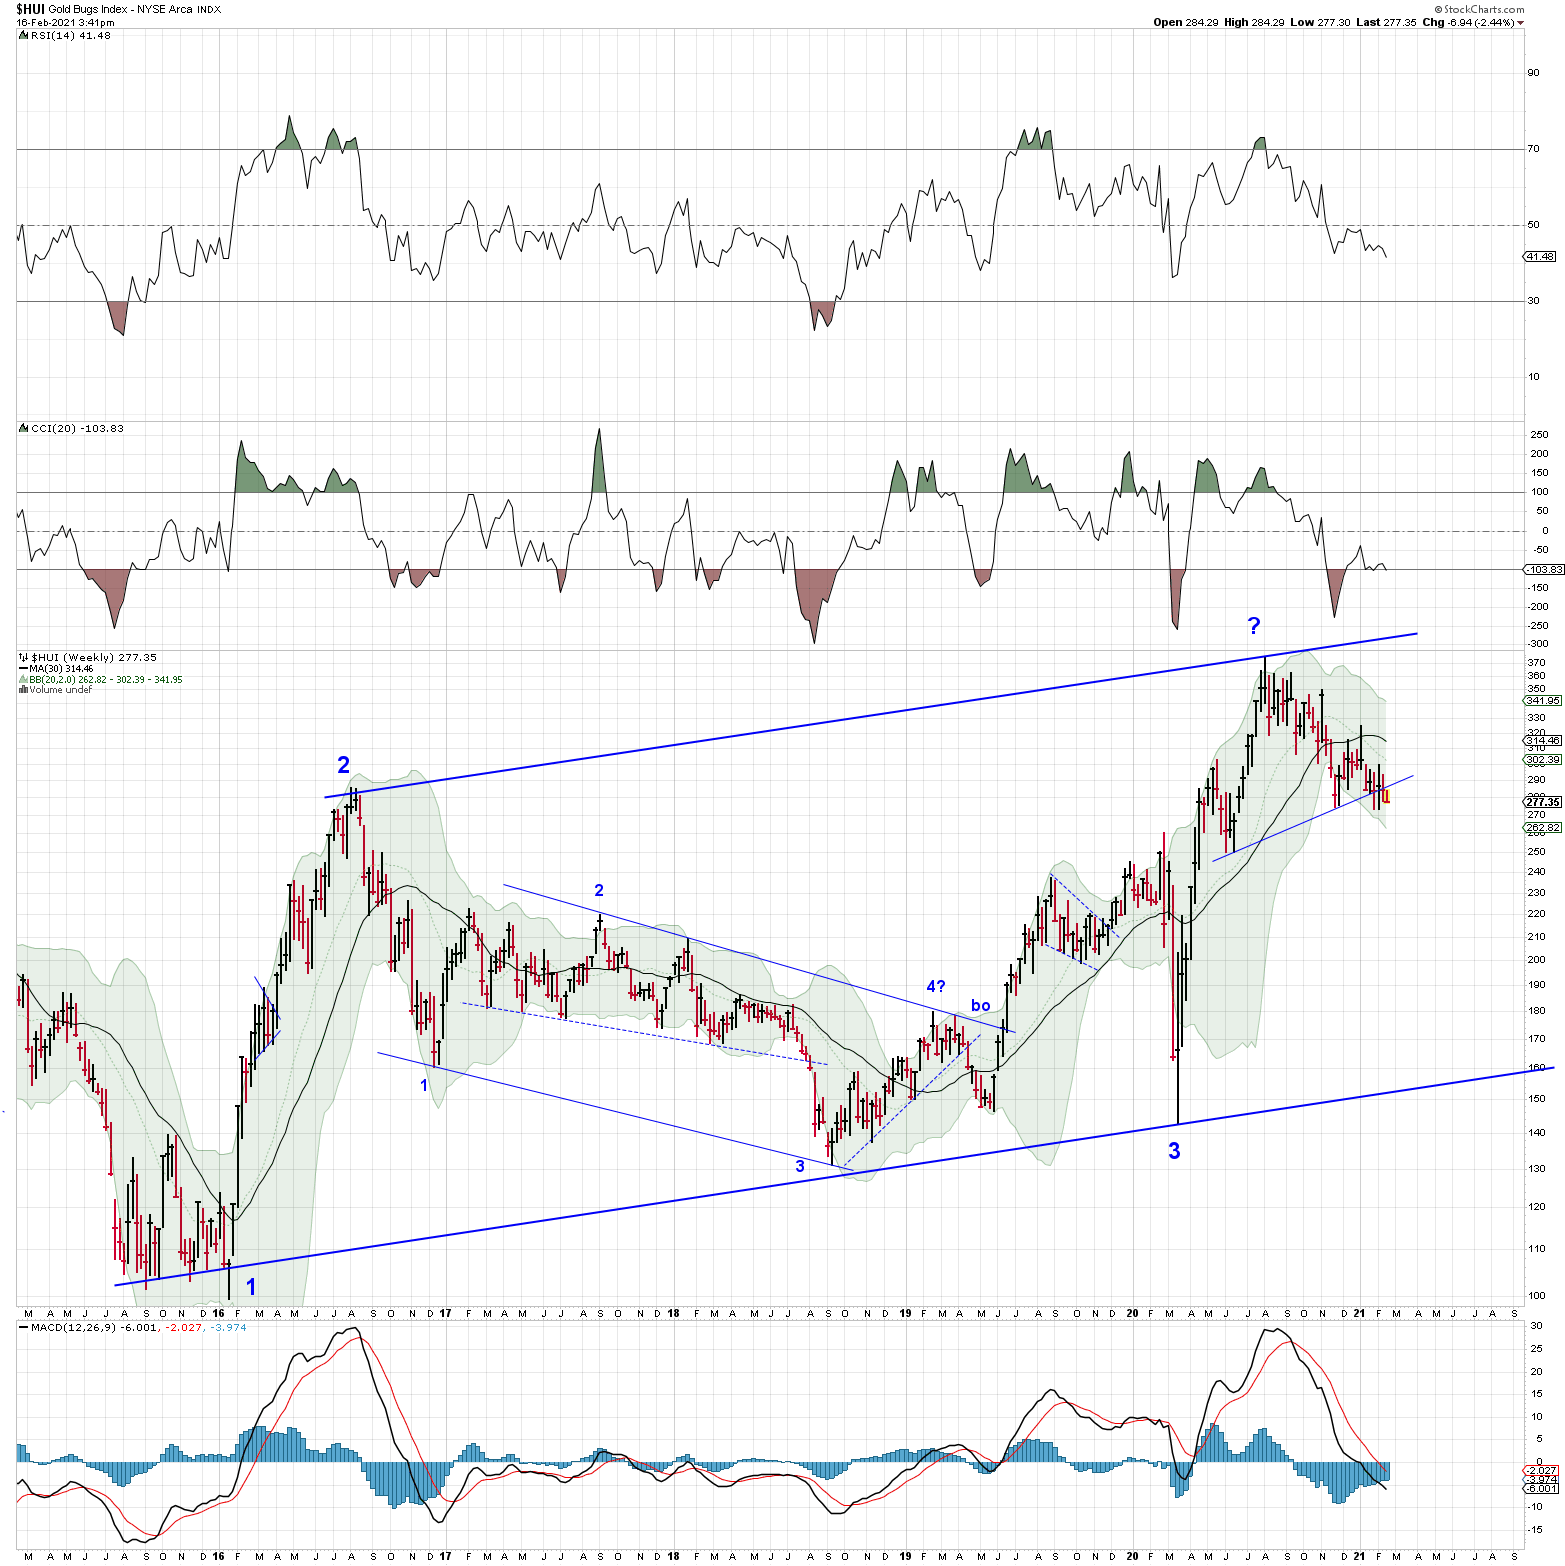
Could be a turning point this week, but to me it’s look out below! It’s all about the U.S. dollar.
FUGLY !
I think you mean butt fugly!
Sorry but I just don’t understand how you can argue for a recovery when it has lost and just back tested the NL and fell away.
This is a weekly chart. Twice before on the weekly chart the $HUI dipped below the neckline and recovered by the weekend.
I did not mean to imply that it will in fact recover. The most likely outcome from this point, to my way of thinking, is a serious decline. That’s the whole point of posting this chart.
However, that sucker COULD pop right back up there, like it did before. (I won’t take that bet though)
Thanks for the comment, Liberty. Cheers.