Silver and Gold – Monthly
Its been said you can’t trade using a monthly chart, and I think that’s likely so. But that doesn’t mean we can’t learn something by examining monthly charts.
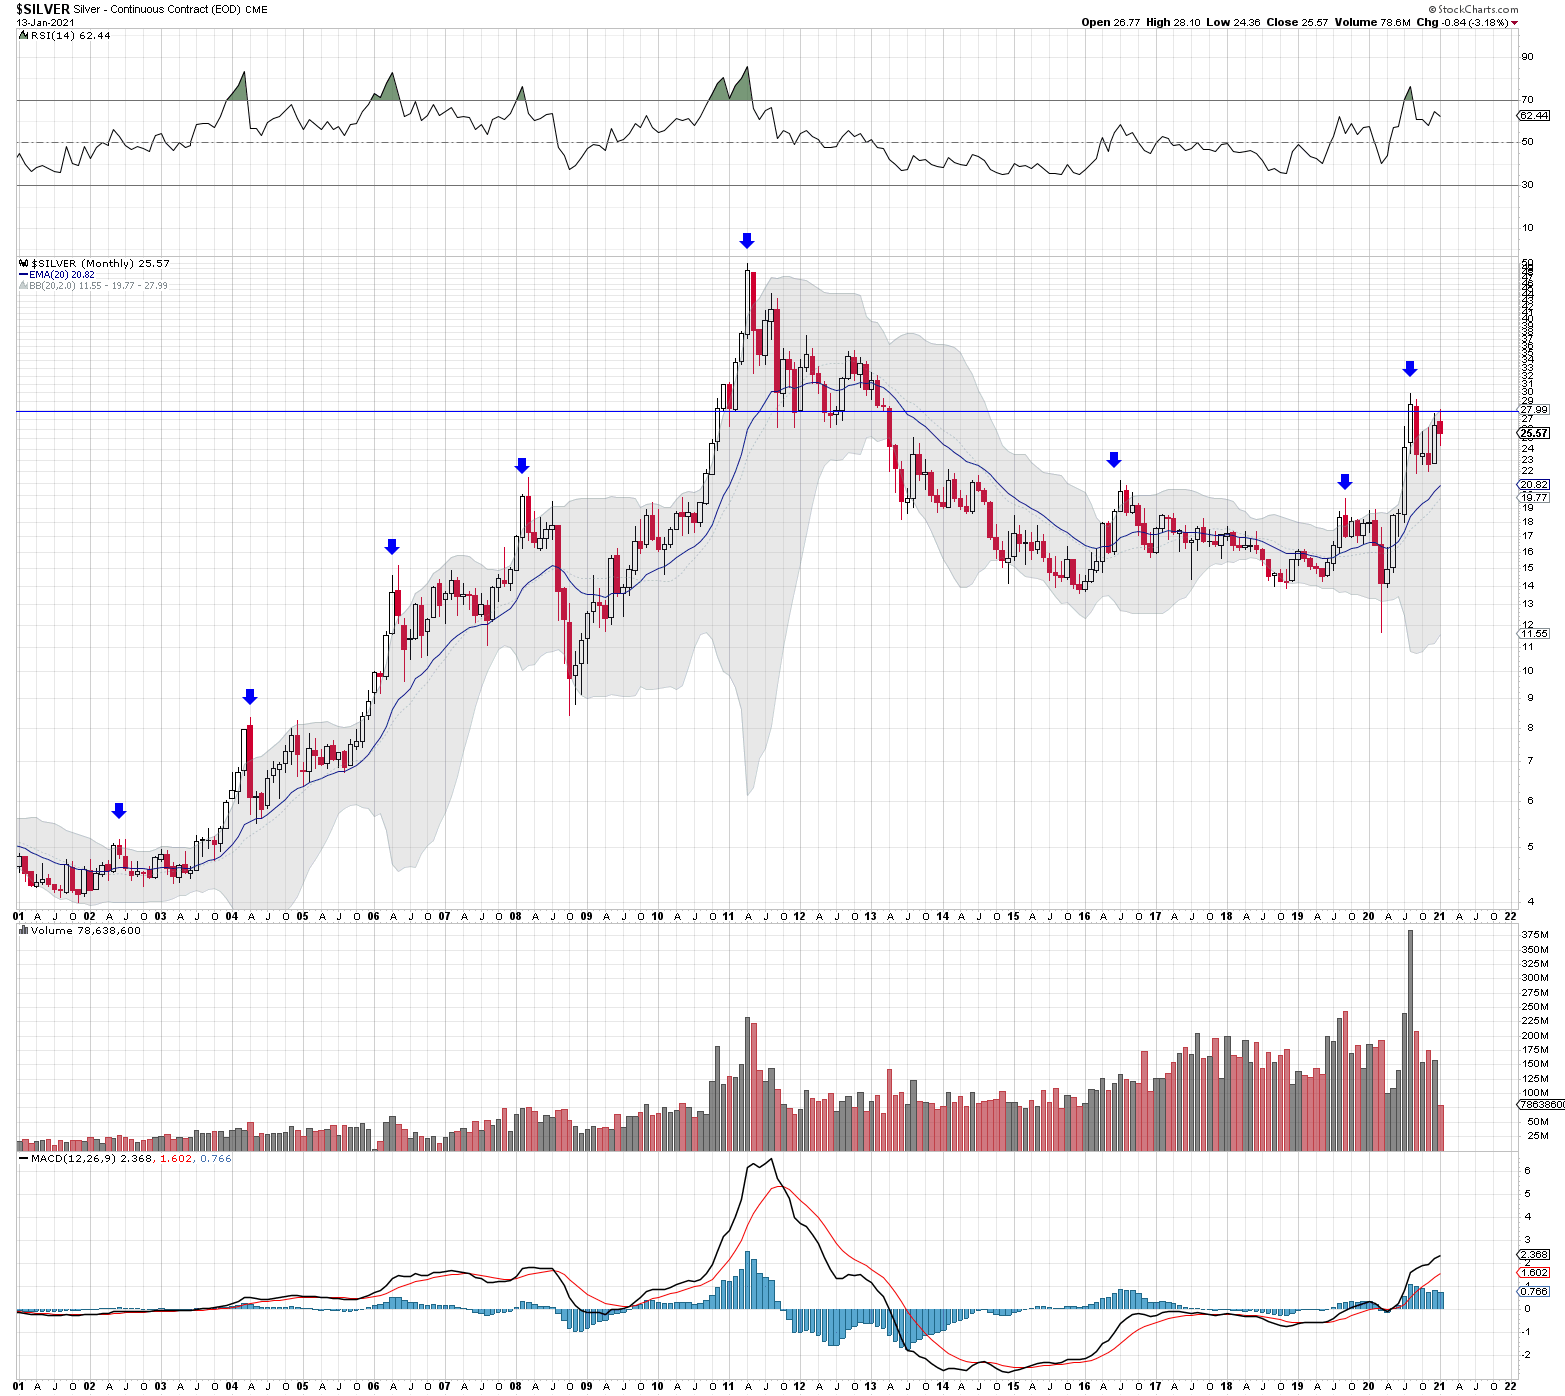
In this monthly chart of Silver, which dates from the start of the great 2001 bull market, we can see that Silver likes to get ambitious and pop up out of the Bollinger band now and then. Every time it does (with the exception of the run up leading to the blow off top – late 2010 to early 2011) it revisits the 20 month moving average and does not make a new high for at least a year – often longer.
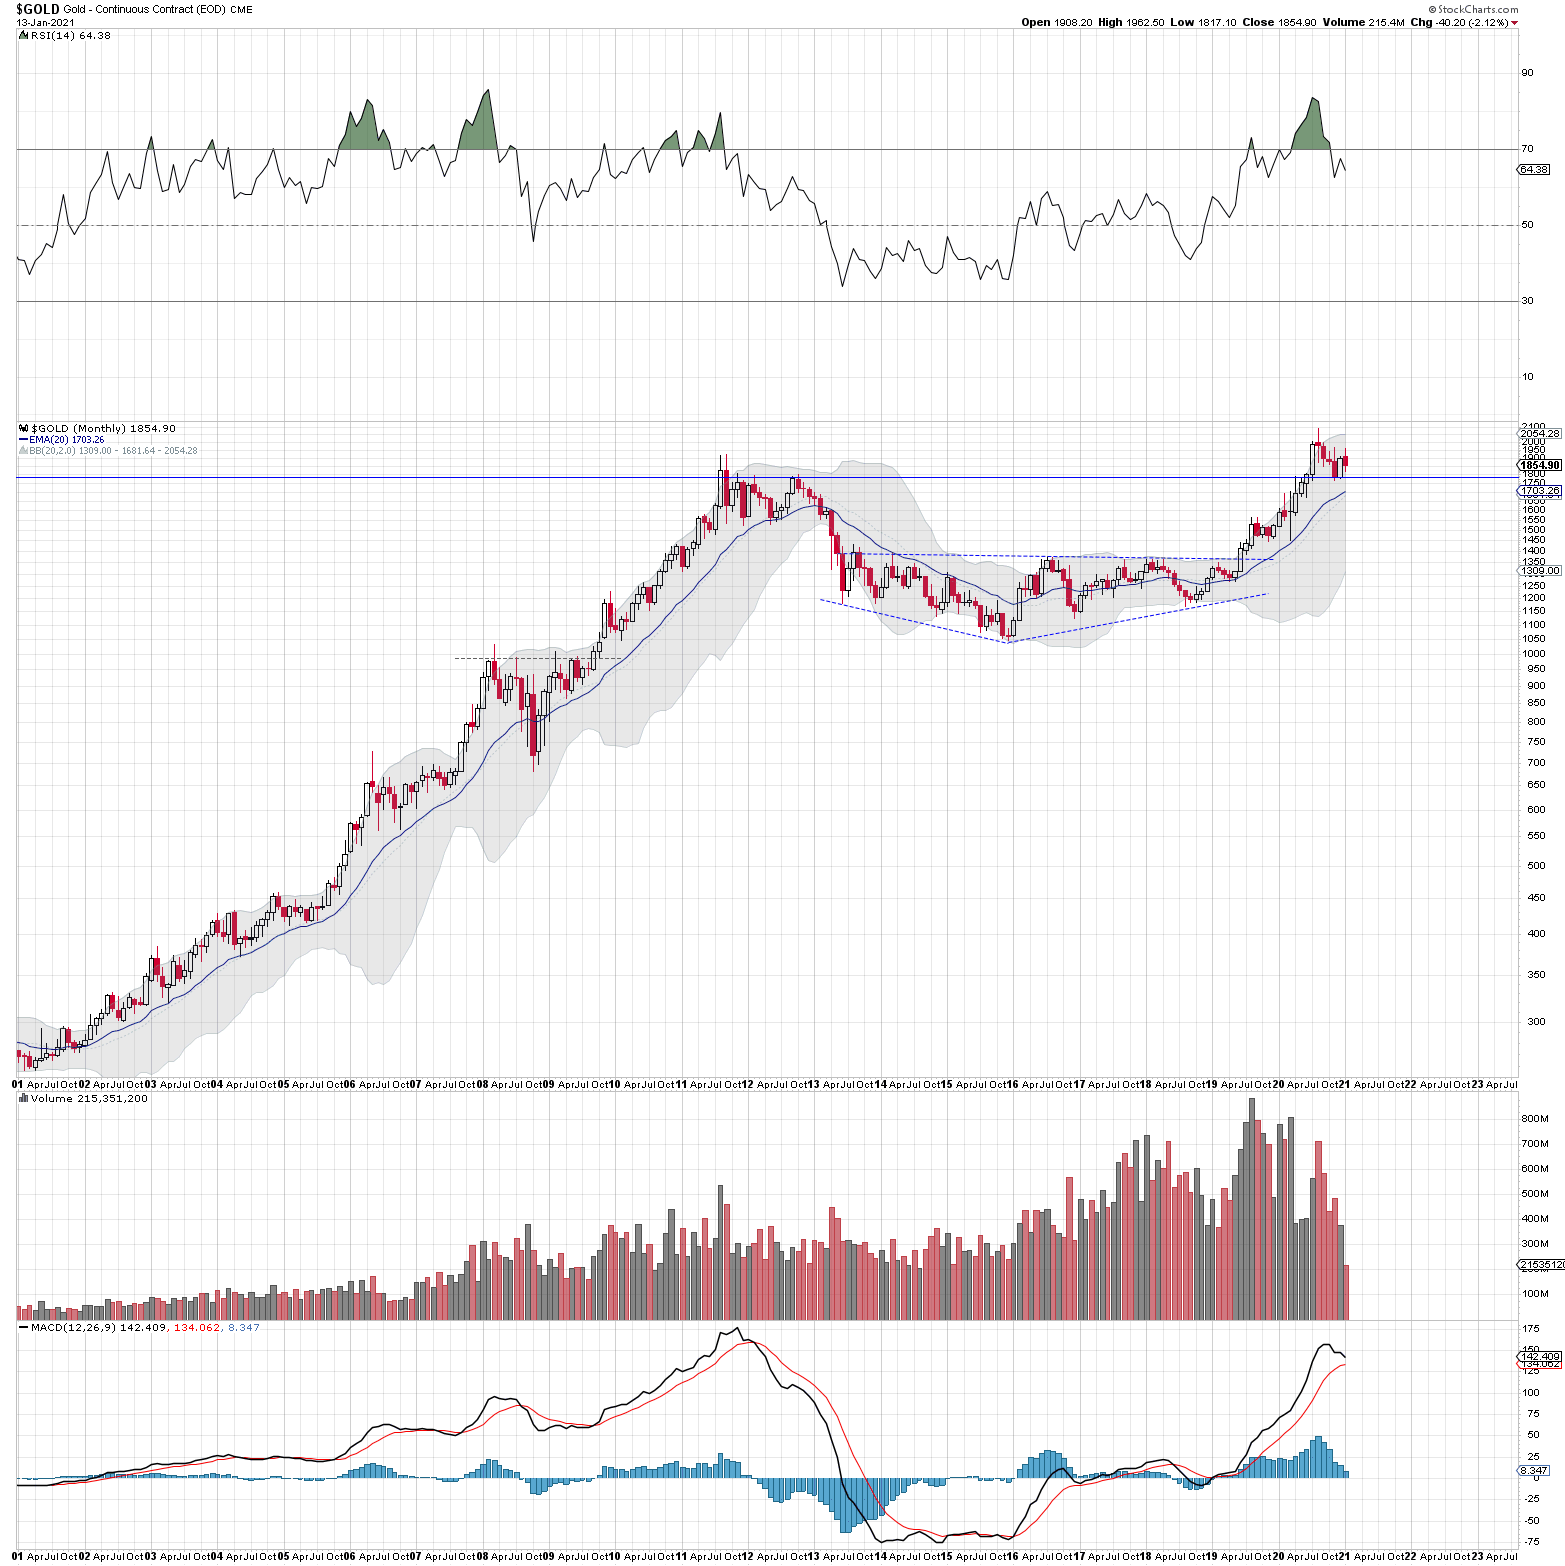
Gold is more docile than Silver. It hugged the 20 month moving average for the first 5 years of the bull move, but got a little frisky in 2006. This exuberance was paid for with a pullback toward the 20 MMA. It got frisky again in 2008 – just in time for the Great Financial Crisis. The following years Gold hosted the run up to the blow off top in 2011.
The take away from these observations is that the present correction is normal market action (compared with the past) It is possible, probable even, for Gold to tag the 20 MMA before continuing higher. These are my own thoughts based on the charts. Do your own due diligence.
Brilliant Observation Foxy
I hate Patience !
I could like with that, not a horrible outcome
I’m in total agreement. And I did make this same observation a couple of months ago. After the type of rally we saw in silver, based on history, it usually takes a year or more to leave the previous peak behind for good. Is this time different? From a technical perspective I would say “no” but fundamentally I really do think this time is different. I don’t think anyone in the world thinks the Fed is capable of normalizing interest rates ever again. At this point everyone is slowly moving toward the theatre door. At some point very soon, that is going to become a stampede.
One bullish thing about the silver monthly chart is that this month’s candle managed to tag the upper bollinger band. To me that keeps the door open to further upside and potentially new highs. If this months had failed to touch that upper band, I think the odds would strongly favor continued sideways consolidation.
February is going to be a very very interesting month.