NOMAN’S LAND
Noman’s monthly $XAU:$GOLD chart is an impressive piece of work IMO and I think it deserves further examination.
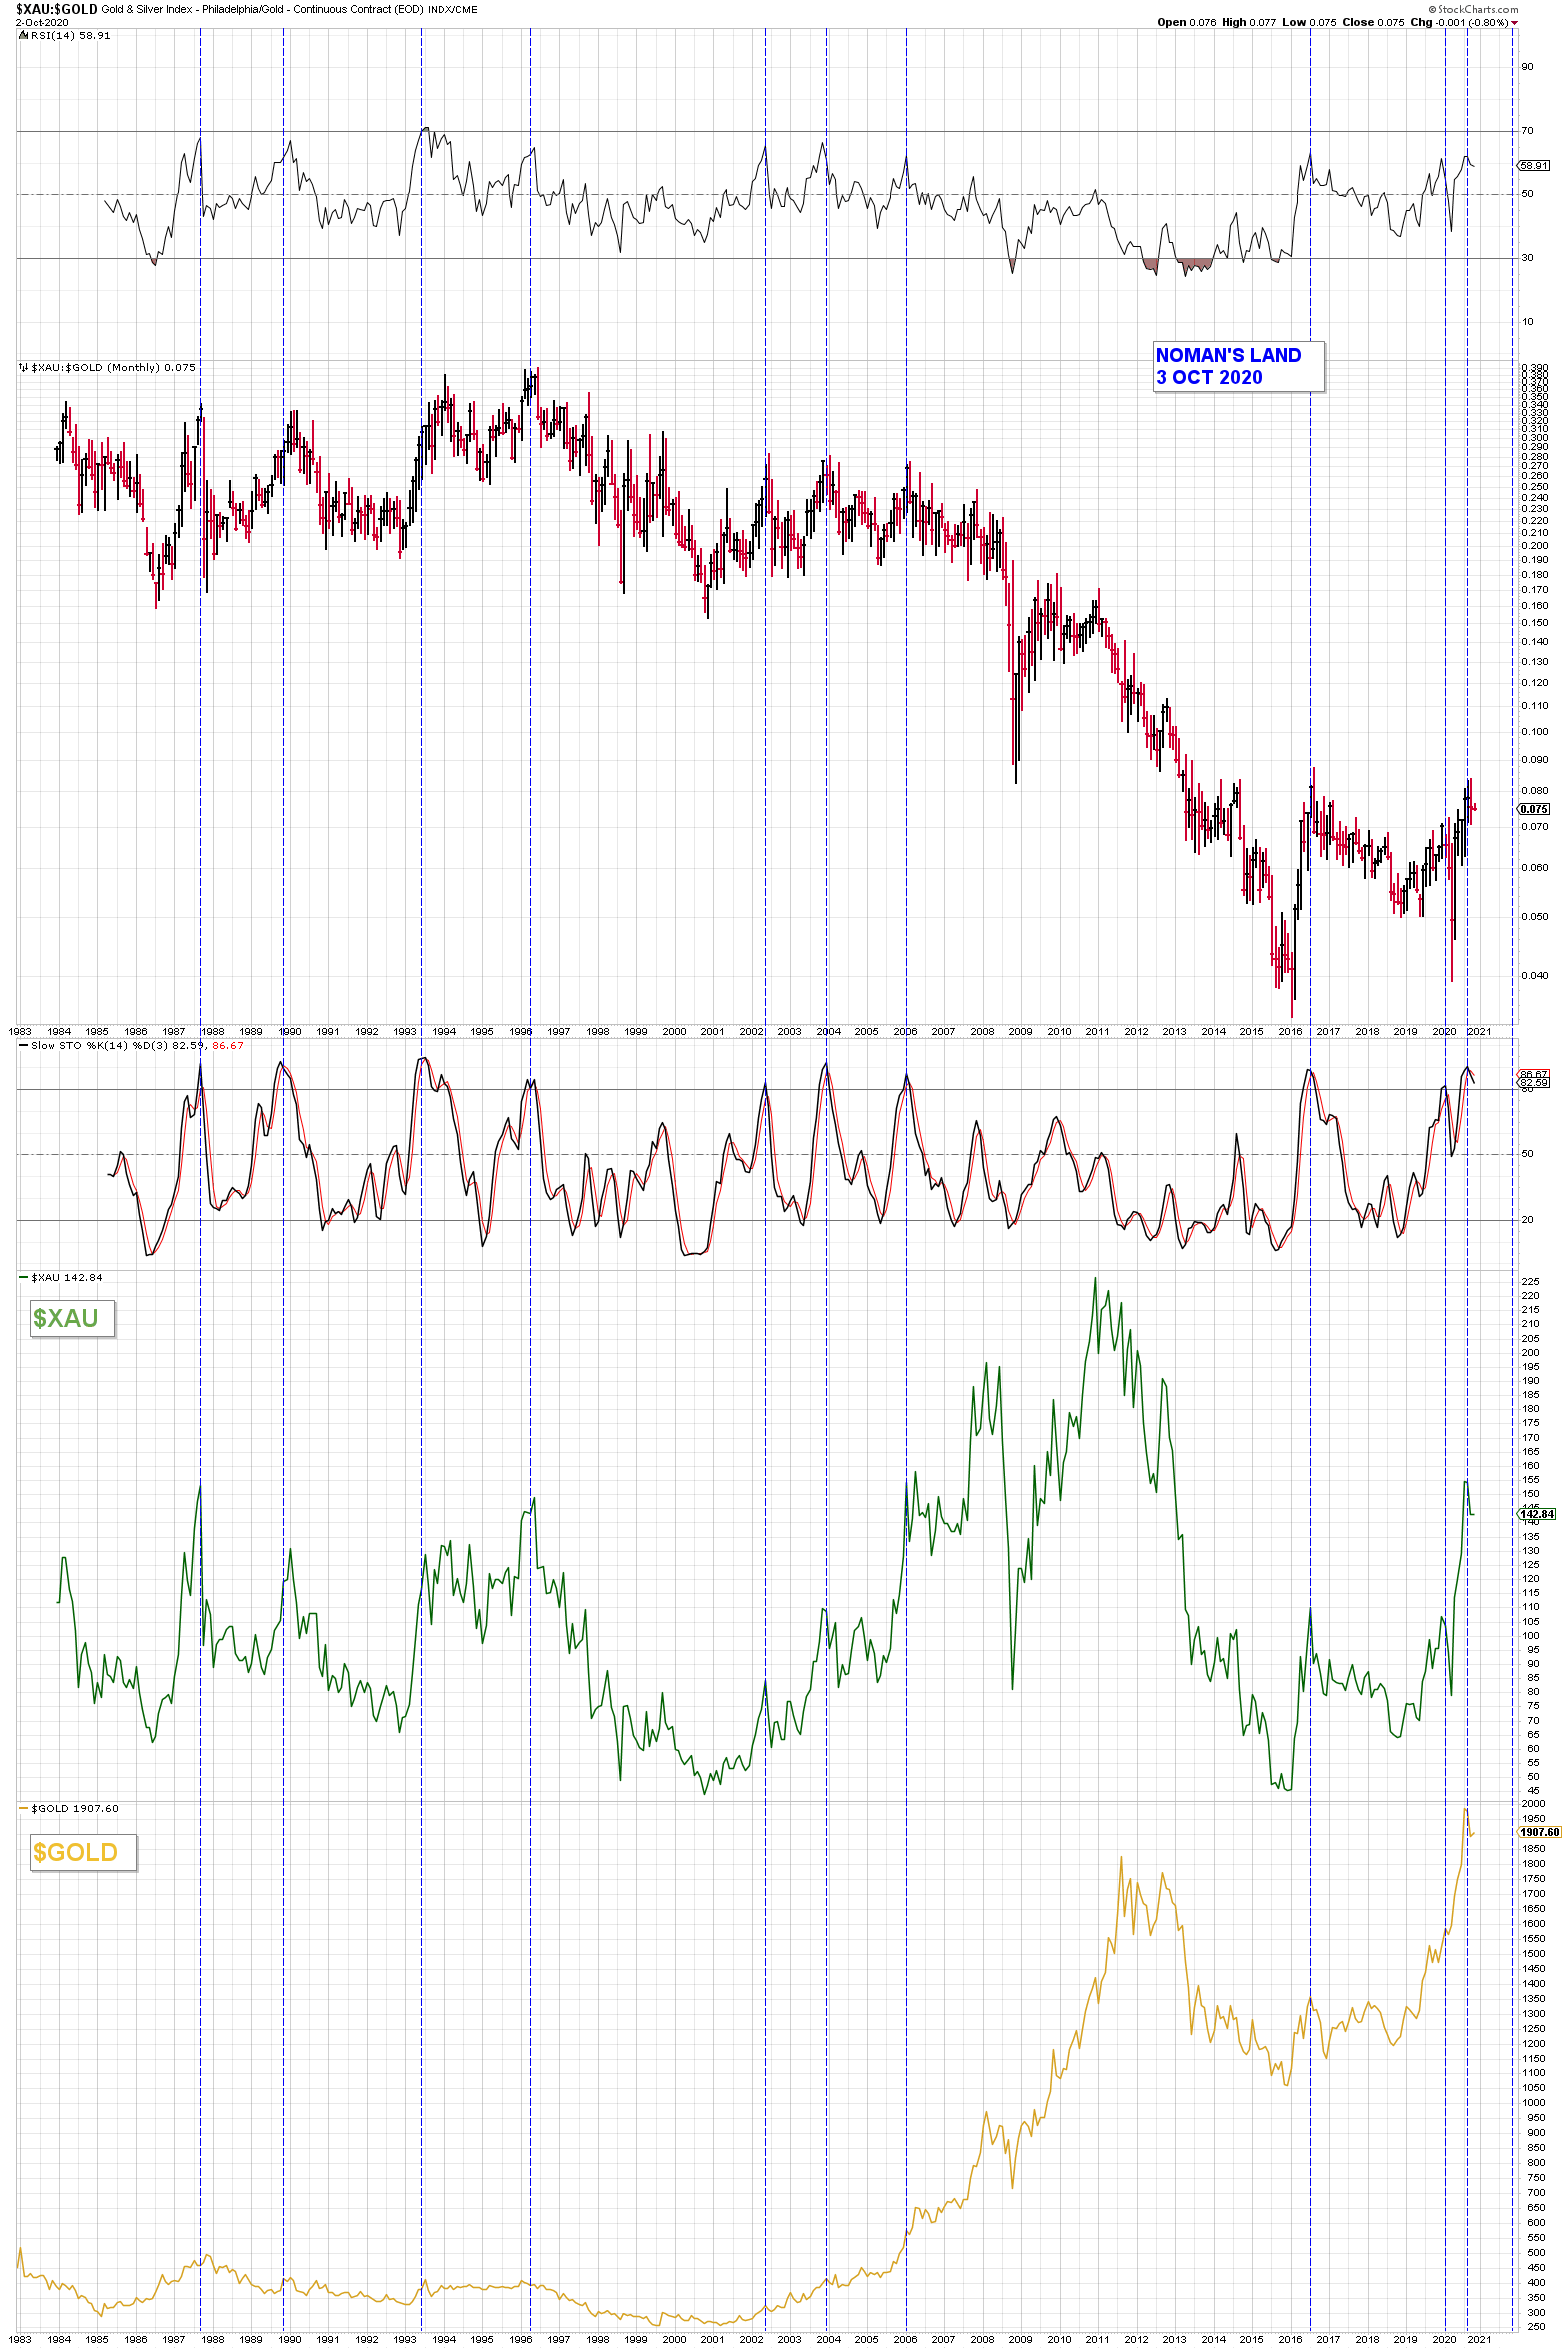
Here is a look at the movements in $GOLD and $XAU in parallel with the ratio.
You will note that the two largest $XAU corrections occurred when the $XAU:$GOLD ratio turned down shy of the 80 mark.
Notice that no impulse rally resumed until the ratio turned up again after hitting the 20 mark, or nearly so, with one exception – in March 2020 when the ratio turned up at the 50 mark. That dive in March of this year was enough to shake the confidence of most PM bulls.
In any case, I don’t believe the near term inflation/deflation debate is yet decided.
Well done Foxy
Nomans Land
I like it
If you consider how long it takes the Stoch’s to reset to the 20 zone it is very sobering. Minimum 3-4 months, normally a year. A real paradox.
Yeah, it takes a long time for the monthly stochastic to reset. There is a similar situation with the weekly MACD on all the PM indexes. It is overbought, has just turned down, and IMO need to reset before continuing higher. It could be be several months before the PMs are ready for the next leg up. We might be in for a prolonged consolidation.
The only thing that might make sense is we are creating a massive right shoulder to the 2011 high whose left shoulder took a year and a half to make. If we dive from here maybe we go into a large trading box.