From Rambus Weekend Report
“How do you know when you are in a strong impulse move to the upside? If you put together an intermediate term portfolio and it is still going higher after 5 or 6 months you can be pretty confident you are not in a reversal or consolidation pattern. An impulse move will begin at the last reversal point in either a reversal or consolidation pattern. You get more confirmation when you see the breakout and backtest to whatever trading range you see. The final thing you want to see after the backtest is complete is for the price action to start making higher highs and higher lows.
Below is what I wrote on April 22nd in regards to the intermediate term outlook for the PM stocks after we had basically finished building out our intermediate term portfolio.
April 22, 2020
There are as many ways to play the PM sector as there are investors. Some will only buy the big cap PM stocks for safety. Others will only buy the mid cap producers. Some will only buy a mix of big caps and small caps. And then there are the PM stock investors that will only play the juniors. Each has its own advantage depending on your risk tolerance. Some of you are wondering why is Rambus’s portfolio structured like it is with hardly any big caps?
After a great run during the tech bull market that ended in 2000 I was able to basically retire and build our dream home. After that bull market ended I was left looking for another area in which to invest. It wasn’t until early 2002 that I saw a chart for gold which was showing a very large base that caught my attention. Whenever I see a big base I have to study it more to see what is behind the price action. The more I looked, it became apparent to me, that a new bull market may be starting to form in the PM complex.
Keep in mind I knew very little about the PM complex back then as I only traded the big cap tech stocks. I only knew a few of the really big cap PM stocks like Newmont, Barrick, ASA and just a couple of others. I didn’t even know there was a sector called the juniors. It didn’t take long after I immersed myself in studying all I could about this new area to invest that I became hooked. I still remember my first trades in the PM sector which were Newmont, Barrick and ASA.
I kept studying this new and exciting area for me and found out about the juniors and the possibility they could offer. I read several articles about how many of the juniors went through the roof in 1997 when BRE-X supposedly found the Mother Lode. Juniors were going up 100’s of percent and many going up 1000’s of percent. There are few areas in the markets that a sector can go up that much so I had to study more. The more I studied this little sector the more convinced I became, that for me, this is where I wanted to trade. The rest they say is history.
I already had the foundation for identifying chart patterns so it was just a matter of finding as many juniors as I could and look at their chart patterns. Since the first leg up in the new bull market had ended there were many juniors with some decent consolidation patterns already in place. I was lucky that I was able to catch most of the 2nd leg up in the new bull market before it ran out of gas and needed to consolidate its gains. When I put my first PM portfolio together I bought 10 juniors all under a dollar and hoped for the best. By the time the correction began that portfolio was up 273% in just under 8 months which was more than I had hoped for.
During the next impulse move up that began in 2005 I had bought 20 juniors all under a $1.00 and when that impulse move ended that portfolio was up 328% in less than a year. Needless to say I had found a new home in which to trade.
What I learned trading back then was that the tide would lift all boats to a certain degree with the juniors that had good looking chart patterns hundreds of percent. What I also learned back then was that when the impulse move ended it was time to get out of those juniors as they could give back a large chunk of their profits during the next consolation phase.
So that brings us up to our current portfolio. One thing about the PM stocks is that it is a small universe and following it through the years you begin to learn about their individual characteristics and how they may behave during an impulse move. Some would call my current portfolio very speculative because I don’t have any really large PM stocks, but I do have a decent mix of some mid caps and juniors.
Sir Plunger’s 4 horsemen are going to do very well and make a lot of money for those that invest in those 4 stocks. For me personally and what I learned in the first half of this secular bull market that ended in 2011 was that the juniors is where I want to mostly trade. If I don’t make at least 250% to 300% on this trade, which I finished up the buying today, then I will be disappointed. I hope it will be more but I’ll be satisfied with the 250% to 300% profits.
Another important point I would like to make is that once you are in a confirmed impulse move the last thing you want to do is try trading it. That was a lesson I learned the hard way though the years. For whatever reasons once you get out of a trade in an impulse move the idea that you are going to buy back at a cheaper price very seldom works out. My experience has been you usually pay up if you want to get that position back.
I posted this history chart for the HUI several weeks ago which shows all the consolidation patterns that formed during the first half of the secular bull market that ended in 2011. The red arrows show you where the impulse move actually began. As you can see most of the impulse moves between each consolidation pattern lasted for many months before they became exhausted. If you recall the last time I posted this chart I put the red arrow under the 5th reversal point on the 2016 triangle reversal pattern. I said I wasn’t going to wait for the breakout before I got positioned which so far has worked out well. The price objective for the 2016 triangle is above the 2011 all time high over 700 but I’ll be satisfied to reach the all time high before the next serious consolidation period begins.
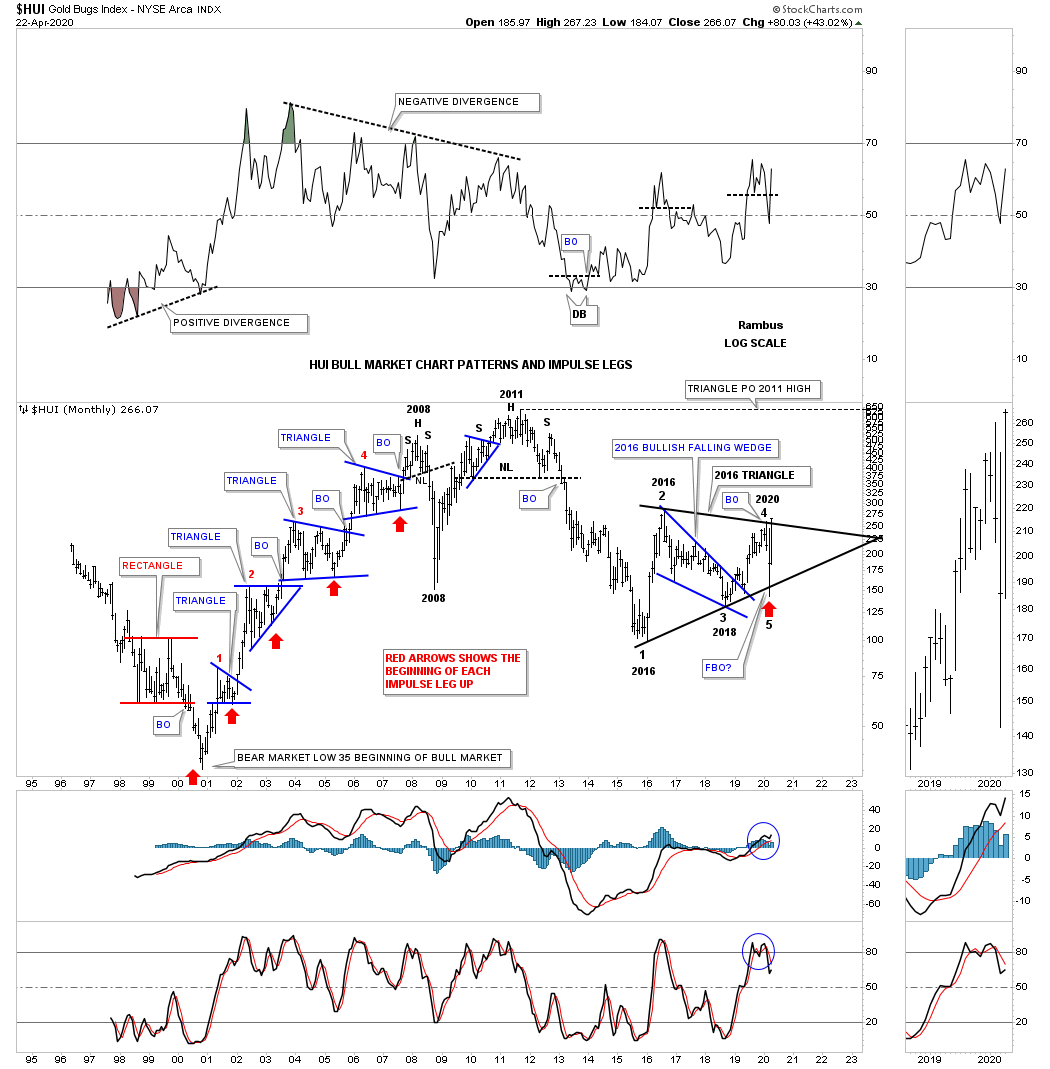
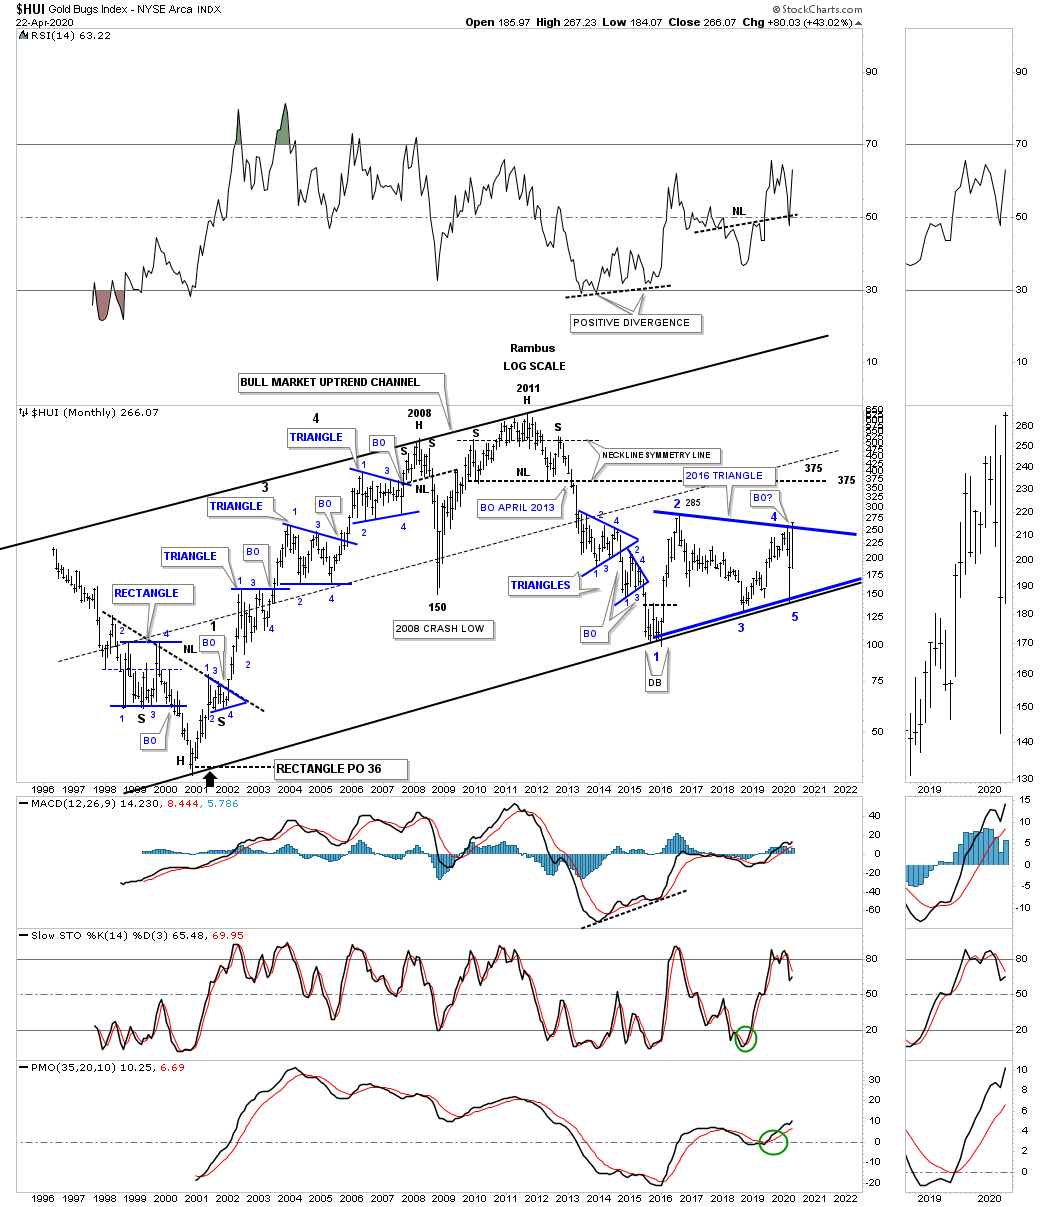
This long term monthly history chart for the HUI shows the crash into reversal point #5 on the 2016 triangle reversal pattern that formed on top of the bottom rail of the 20 year secular bull market. That was another great clue to get invested.
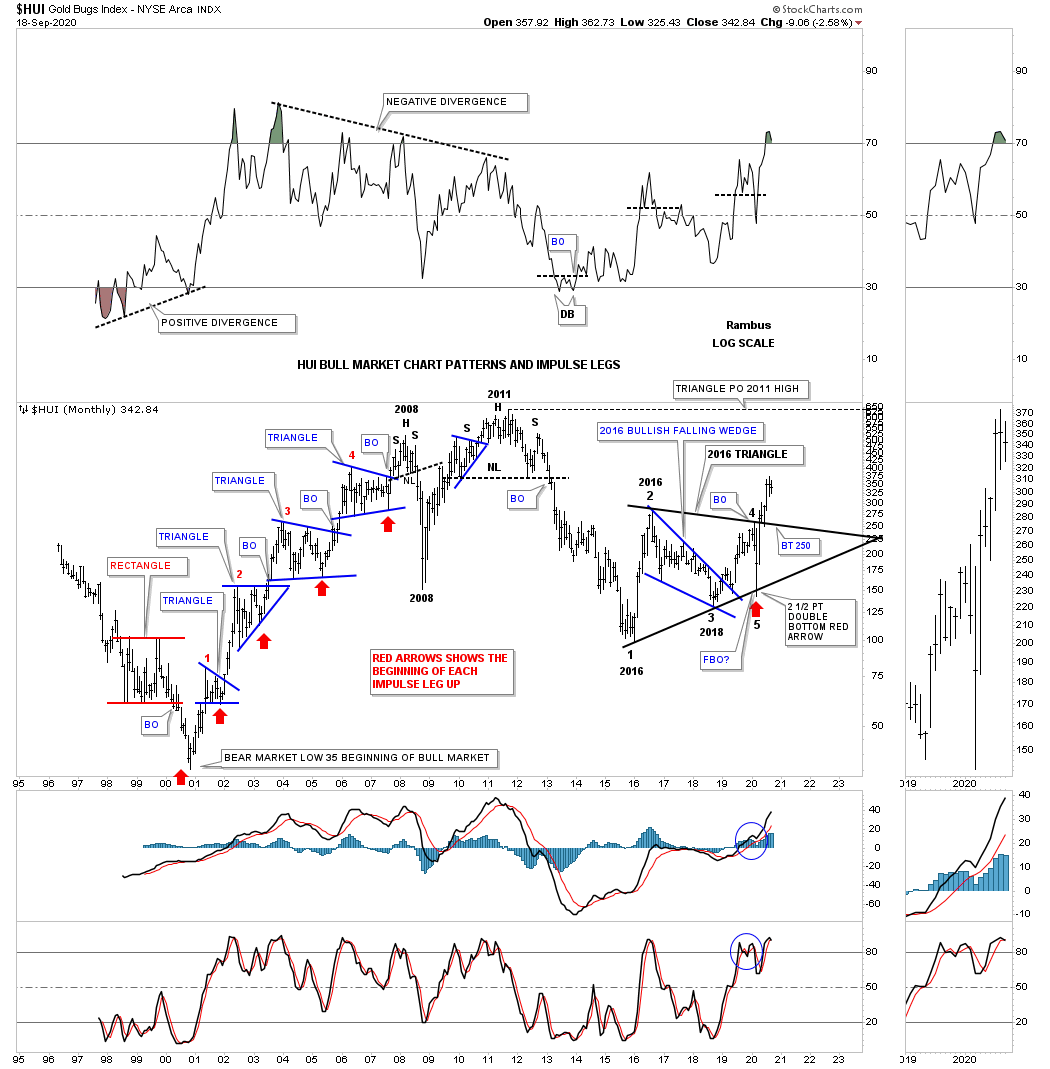
Fast forward to the present September 20 five months later.
Below is the exact same long term monthly chart as the first one above with this chart showing the breakout and backtest which so far is textbook Chartology. The reason I’m showing you these 2 long term monthly charts four months apart for the HUI is because when you get the big picture figured out with confirmation of a breakout and backtest the odds go up dramatically that you are on the right track which gives you confidence in your ability to understand what is actually taking place. Most investors that don’t have a trading system whether it is Elliot Wave, time cycles, Chartology or whatever it is have no clue on what could happen next. The fundamentals don’t show you where support or resistance resides or if a stock is consolidating or is in an impulse move. Any trading system that you believe in is better than none.
HUI September 20, 2020.
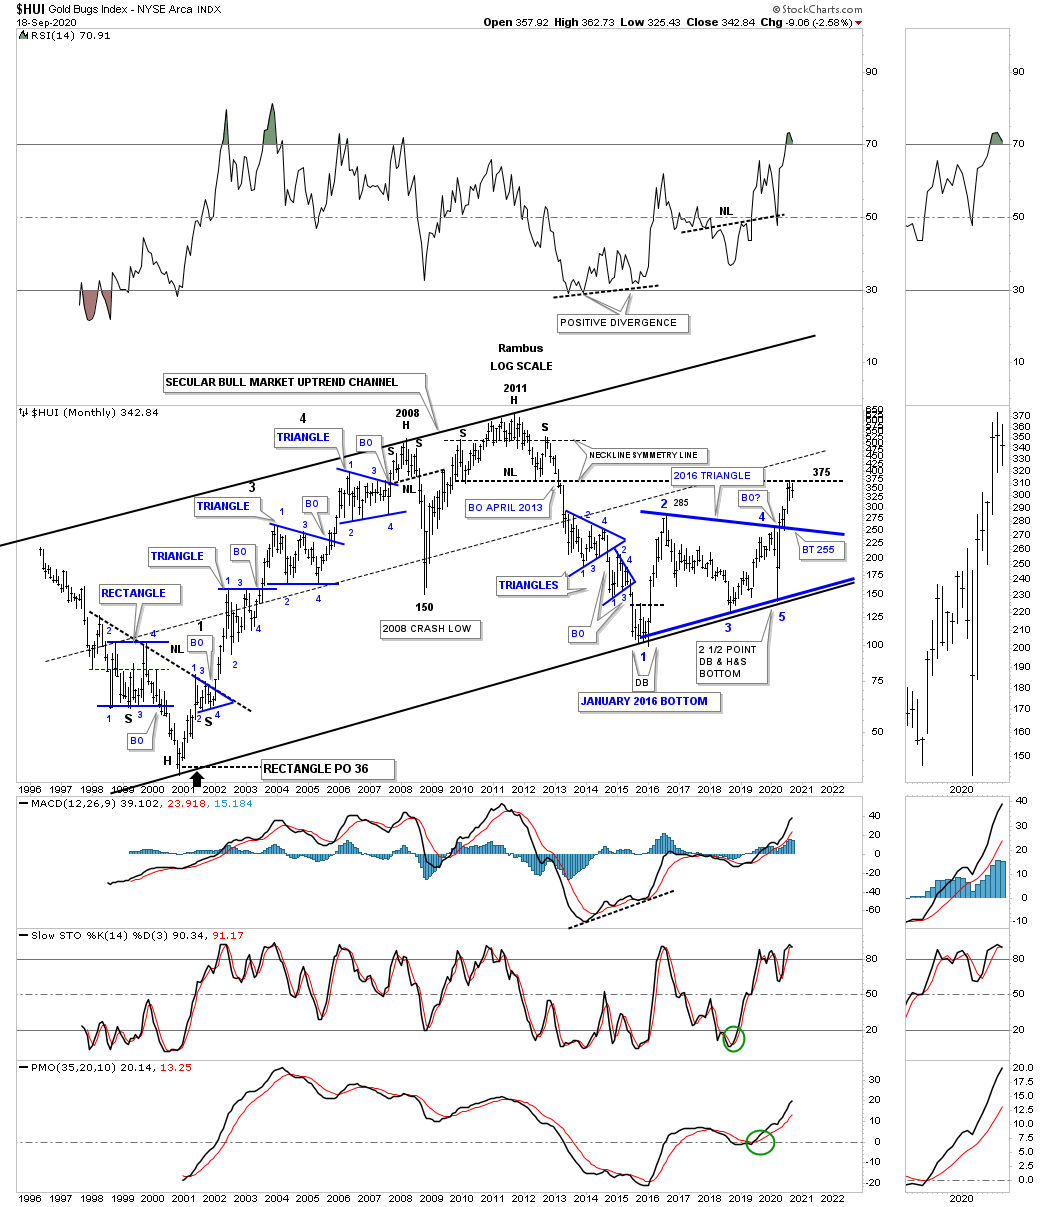
Below is the updated version of the April 22nd long term secular bull market on this monthly chart as of September 20, 2020. As I have already shown you on the long term month combo chart for the PM complex that most of the PM stock indexes have already broken out above their respective 2011 H&S neckline extension line where as the HUI is still testing it from below.
HUI September 20, 2020
Tonight I’m going to show you all of our weekly intermediate term trades in the, PM Stock Trades Portfolio, because I can sense that some of you may be losing faith that our bull market isn’t the real deal as the correction enters into its 8th week.
We began to take our first positions on April 2nd one week after the March 23rd low and acquired a total of 28 positions. Normally I would have just taken 20 positions but the charts were so compelling that I borrowed some cash from the Kamikaze Portfolio and the Leveraged Trade Portfolio, to complete the portfolio. Out of those 28 positions we originally started with we are batting 1000% so far with no losses. I have sold 3 positions, GORO, MUX and NAK for small gains.”
…………………
Charts of Rambus PM Portfolio of course are for Subscribers
Take the automobile, airplanes, washing machines industries and there are periods where buyers go away. Not with gold and silver. Every ounce of gold produced is always sold. It’s not like corn or wheat that piles up in granaries when you have a bumper crop. DRD gold produced 174K oz of the good stuff in the last year and sold every ounce of it. Right now as we watch this weekend arranged? Monday morning carnage DRD
is producing gold every day. They dig it up for about half of what they sell it for. The stock peaked at $18 in late July and is now on sale at $11.50 pre market. 30% correction. Their third QTR profits will blow the second QTR profits out into space with the massive rise in the price of gold. It does not matter if gold goes up 50 or drops 150, DRD and many other miners are simply killing it with their free cash flow. DRD is a leader stock. It formed a HS top on July 27 days and weeks before most goldies turned down in August. It will turn up first. It is very near it’s 200 ma. Starting in 2018 I watched KL make some fabulous moves and occasionally move back to the 200 and it held every time.
Here we go…..again
lol