Gold’s Bollinger Band Madness (added Silver’s)
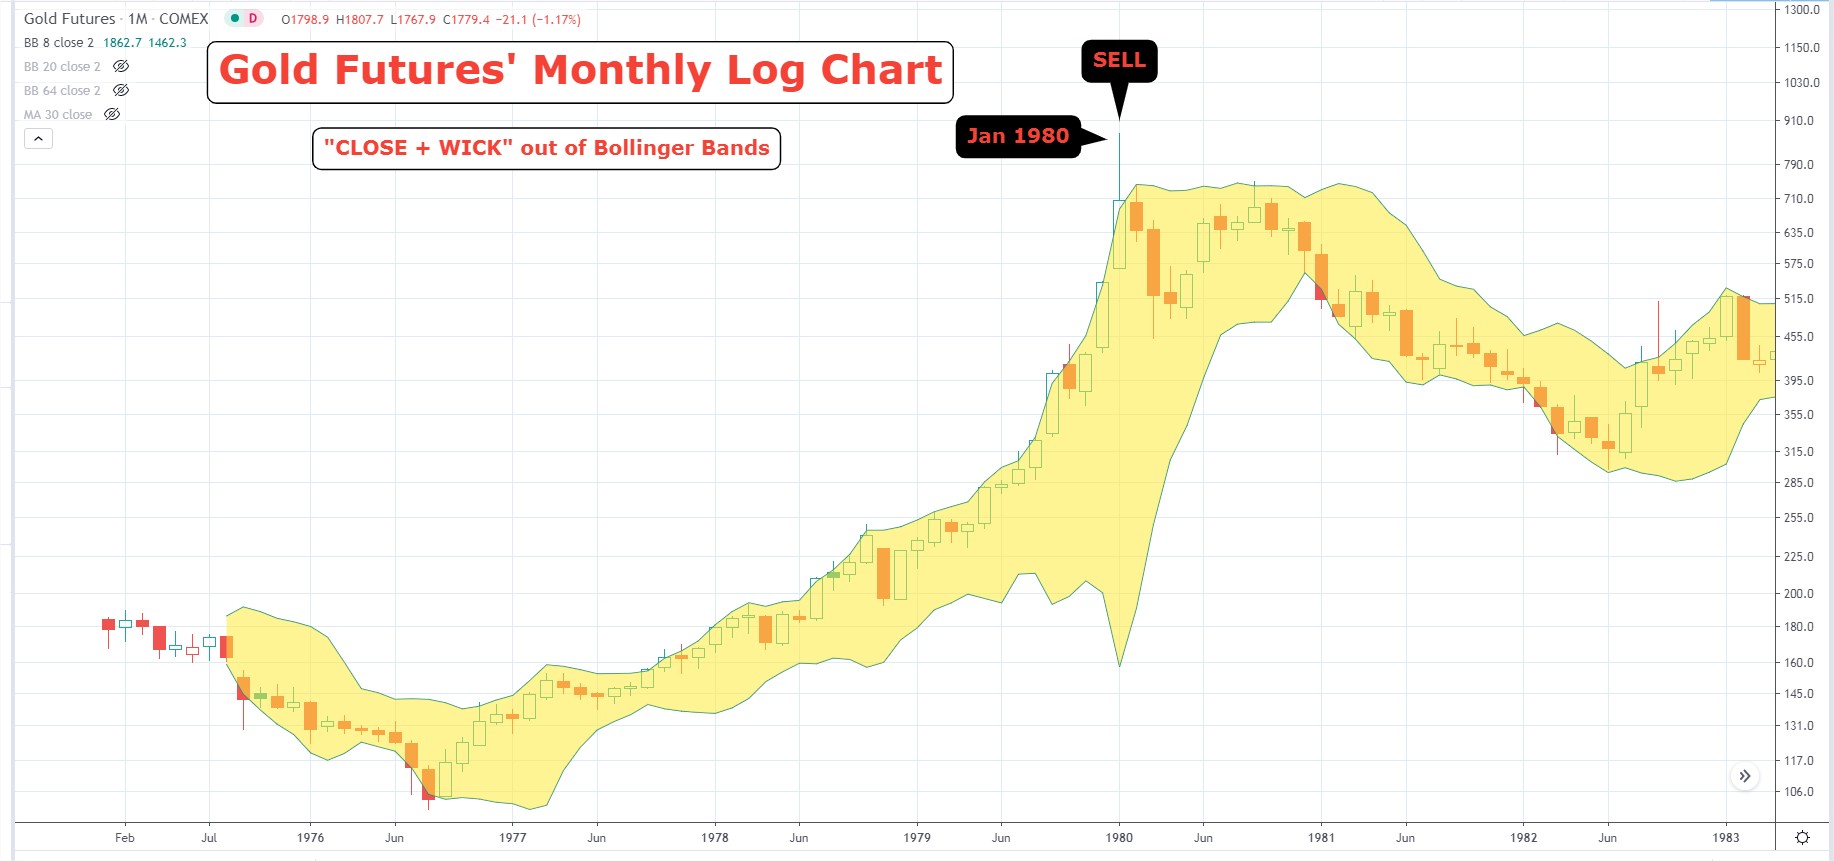
BB 8 on Monthly Log chart for Gold.
Now.. how many times did we have a solid monthly close above the upper band WITH a good sized upper shadow (wick signalling strong selling pressure during month off highs)?
And what happened after?
When you get just a Marabuzu candle close out of the band… unusually some months of consolidation required before resumption of trend. When you add the upper shadow on top… then signaled an exhaustion of trend.. with a strong correction or bear market afterwards.
Here is the tail end of 1970’s bull market for gold.
And here is 2001-today. Look where we are now… no where close to exhaustion.
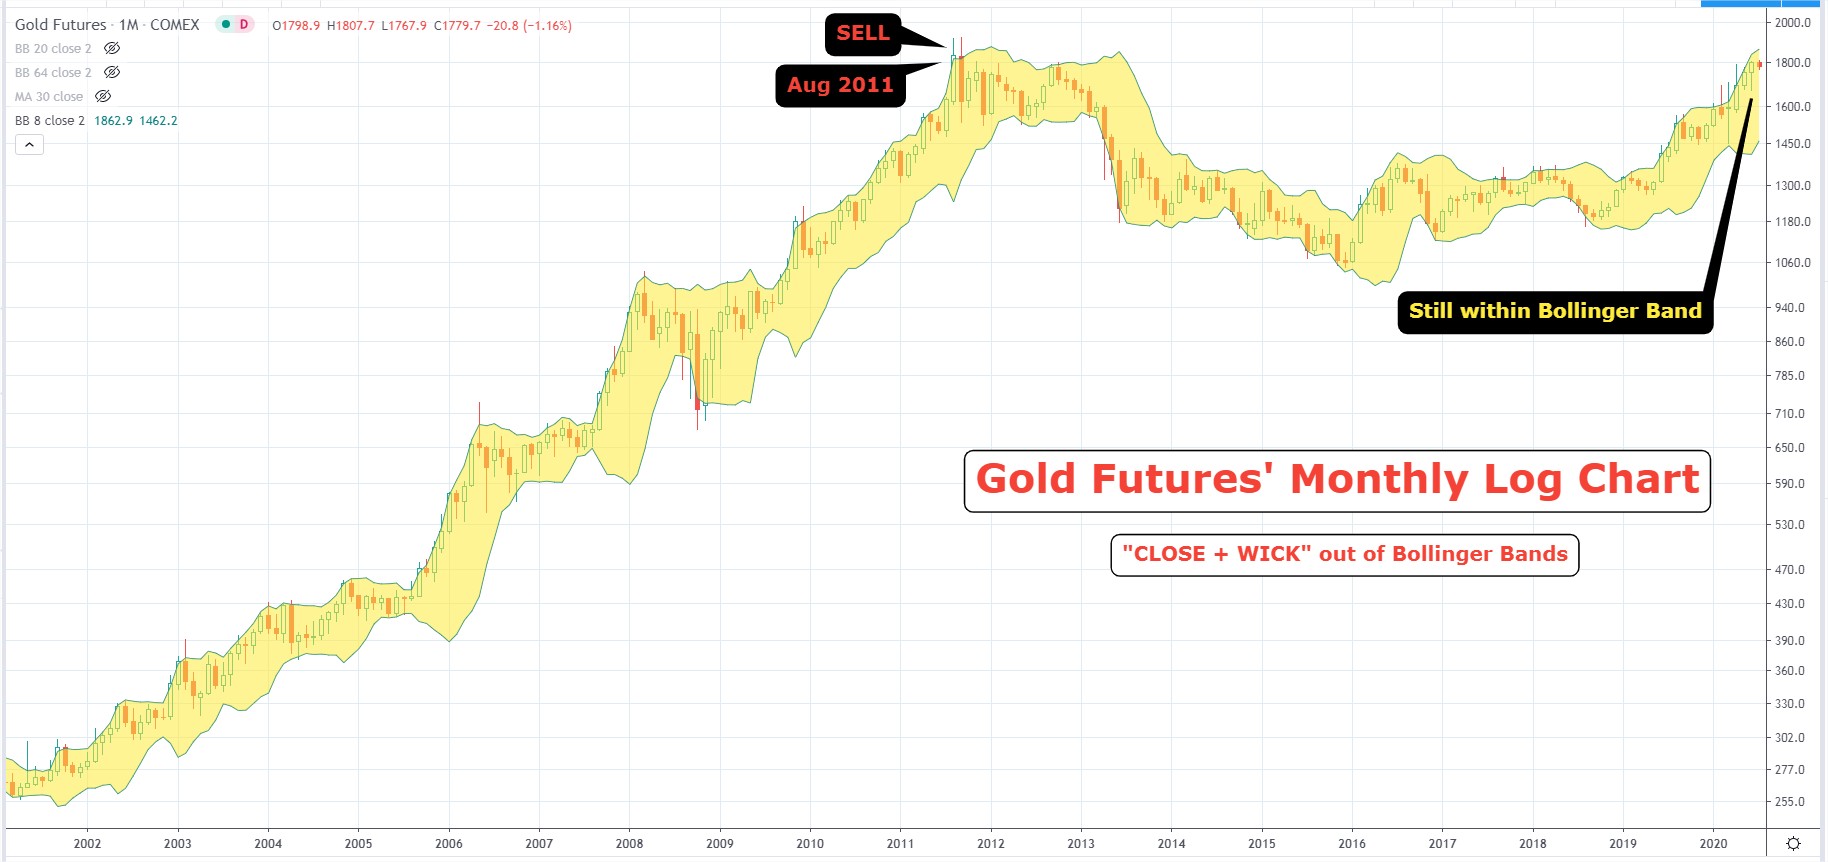
If you have bought right… time to sit tight.
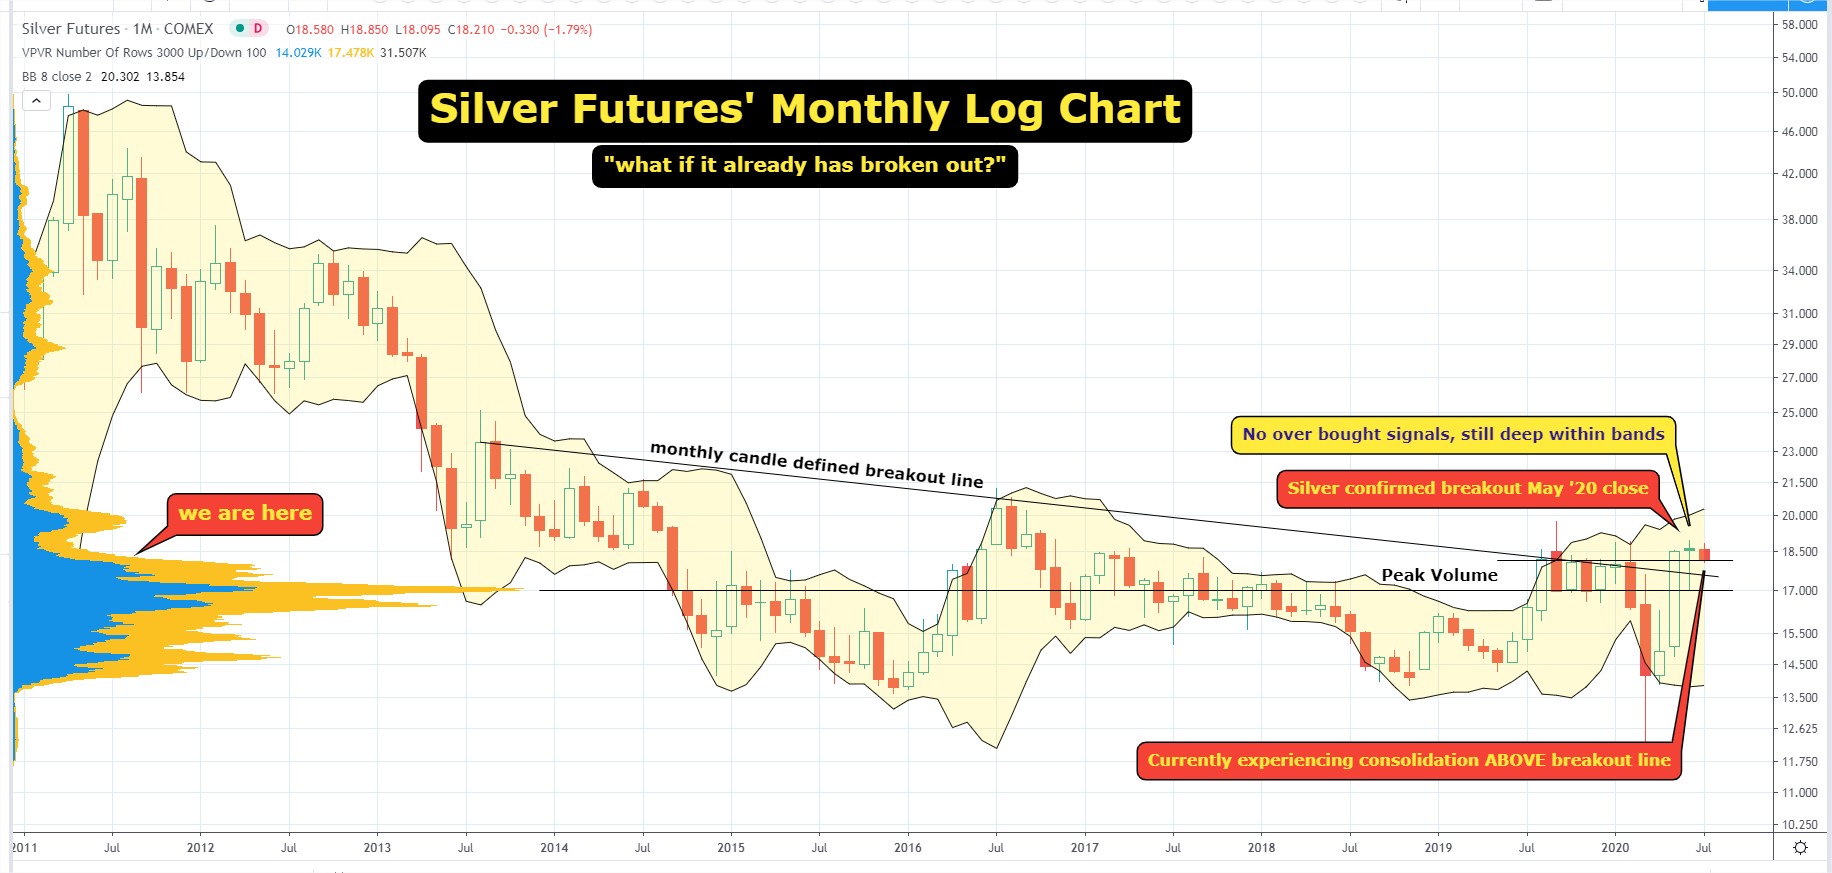
Edit: Adding Silvers chart… I sometimes think it already has broken out a couple of months ago…
Useful analysis. Thanks Patrick.
Yes… I think so too.. needed another approach so see if we had already over extended… really not.. for both gold and silver.
Another way to look at it is to consider how much money is in the gold space/miner space. Four tenths of one percent as of the 4th qtr of last year. For anyone to argue we are extended or whatever is simply retarded.
Not intended for anyone on this board!
I am, nonetheless, retarded, ever since the gold bug bit me and dissolved half my brain.
LOL