Stan Weinstein’s toolbox is KEY to understanding Silver.
Some more original use of the Mansfield Relative Strength to understand Silver’s relationship to Gold. These two charts have crystallized what to expect from silver’s performance, and not rely on a “high” gold vs silver ratio… but actual relative performance. This also gives some views where to exit and enter silver!
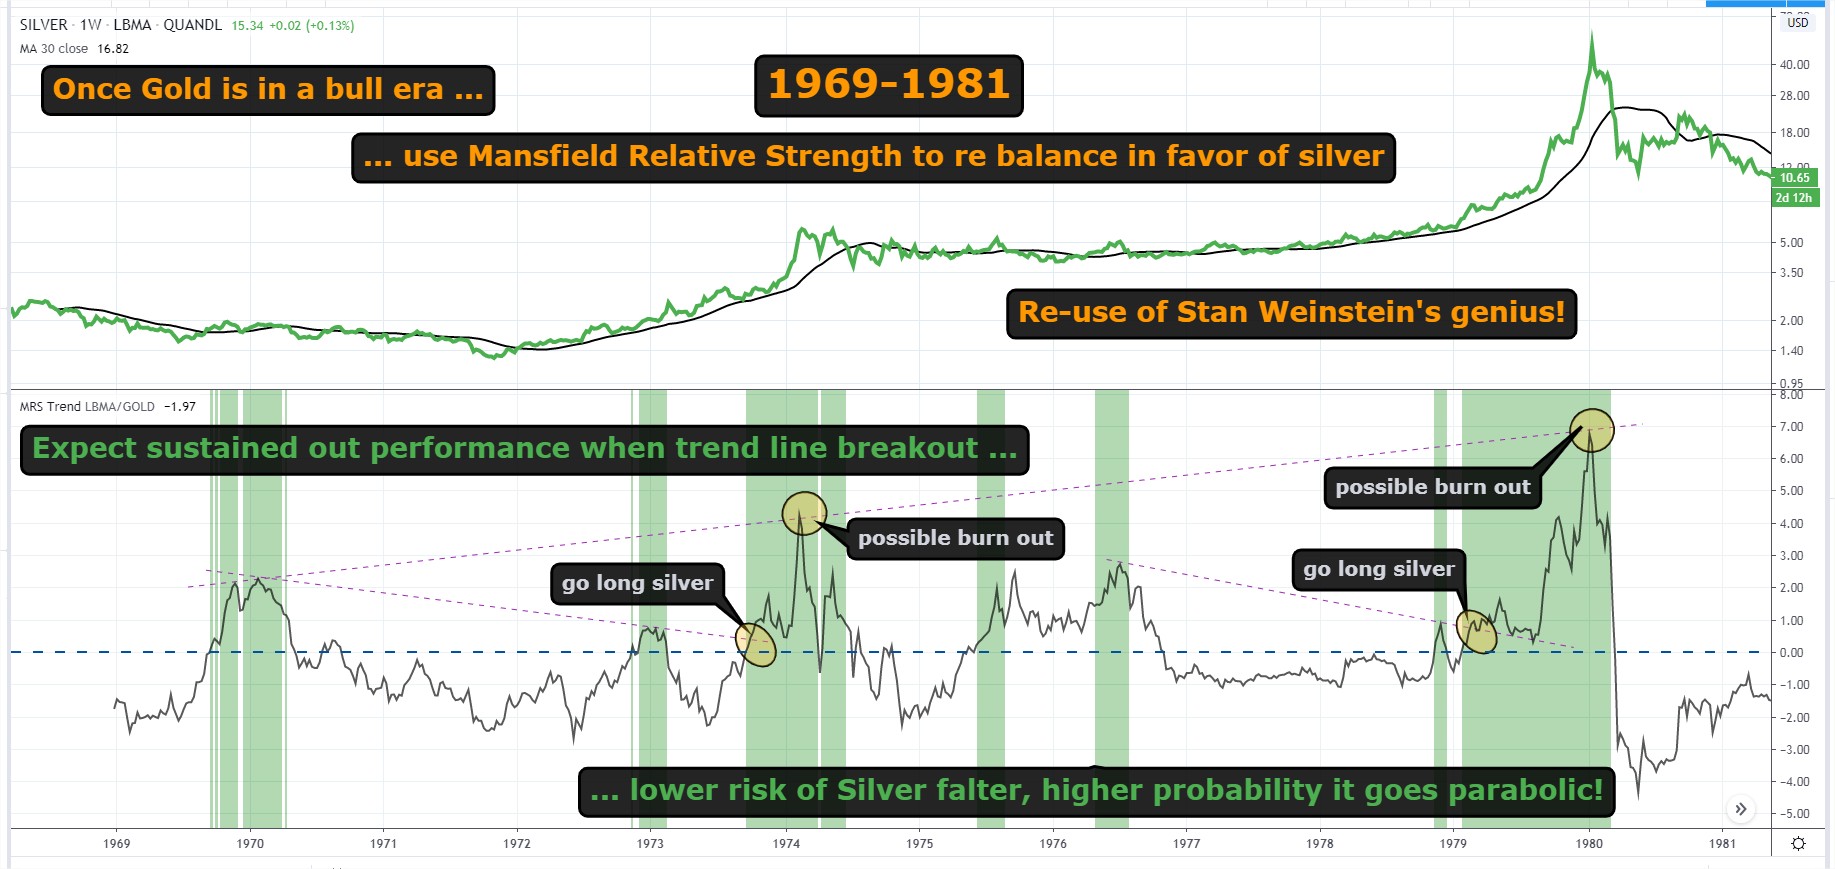
Funny, these explosive moves of silver vs gold come in threes! Such a strange and wonderful beast!
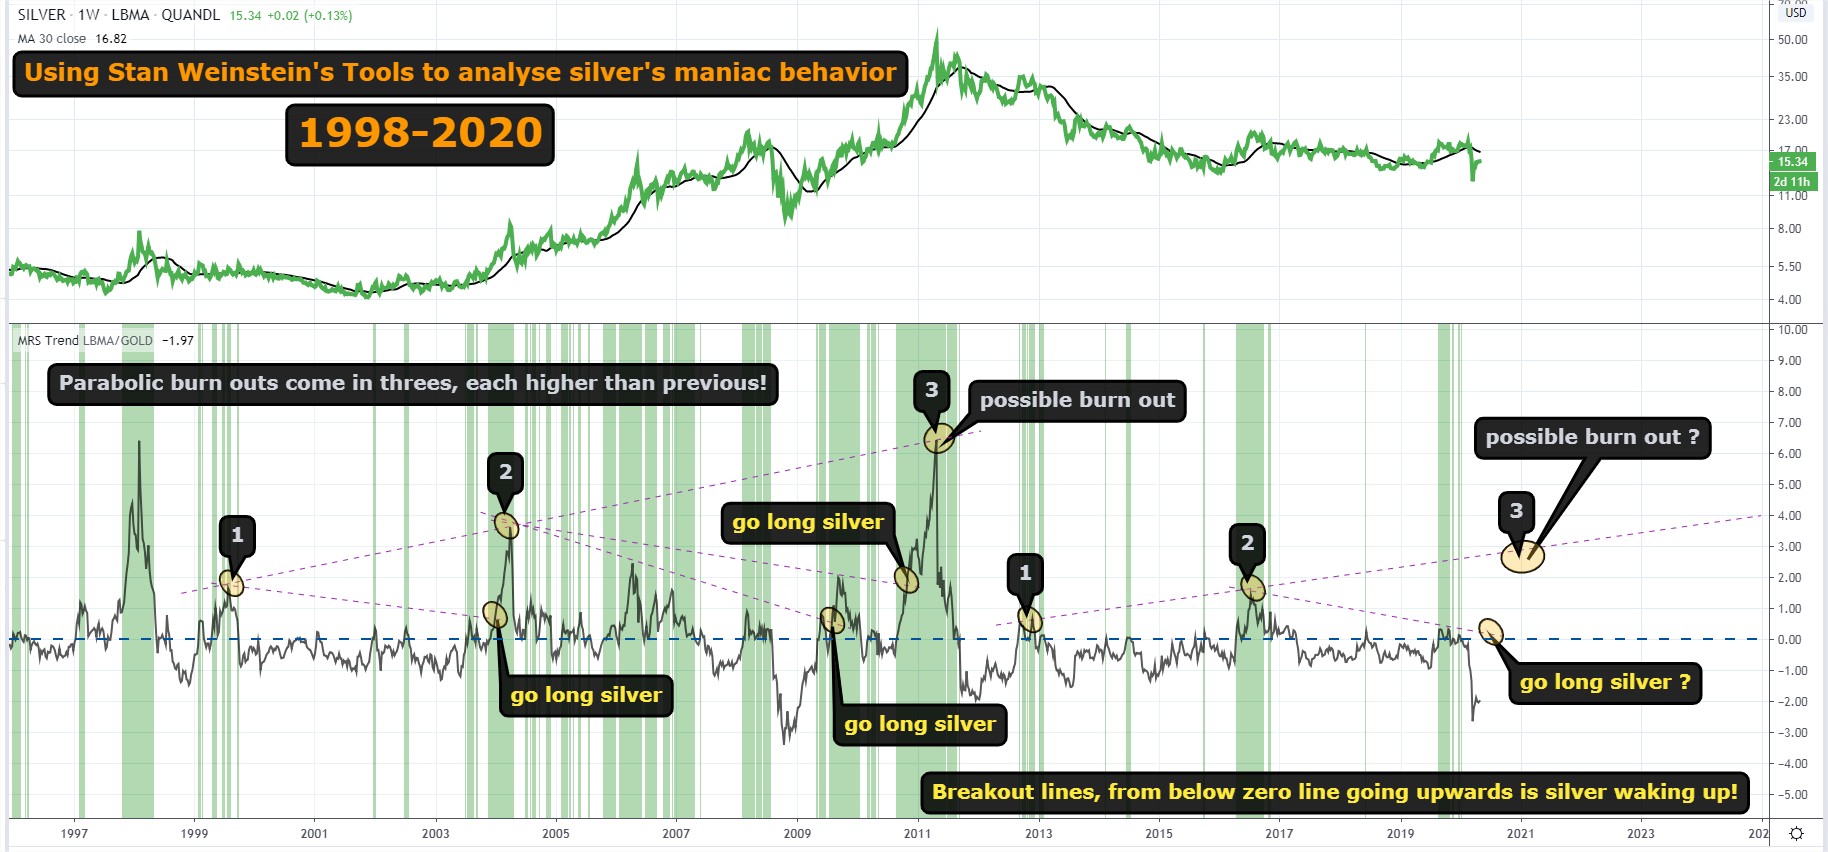
Edit: I just noticed expanding time cycle in 1969-1981 bull era. Ex. From 1st burst to 2nd is 4 years.. and 6 years from 2nd to 3rd. Now, If applied to today’s bull era… we have been PERFECTLY following this script. Silver should peak vs gold in 2022
so basically, we’re not there with silver yet! Interesting data. Thx.
Looks like that. But the gambler in me could see this as silvers bottom… and take a small early position. But i haven’t pulled the trigger yet.
Hey Patrick,
I really like that chart using the Mansfield RS indicator. So correct me if I’m wrong, but the Mansfield indicator compares the relative strength of silver to gold, and it shows where silver gains relative strength vs gold by a breakout over the 0 line? Am I correct? Is there anywhere with a reference to read up on the Mansfield indicator – is it in Weinstein’s book “How to make profits in Bull and Bear markets”? Thanks for the great chart.
Here is the logic behind it. Yes a cross above zero is bullish.
Extract from: https://www.stageanalysis.net/blog/4266/how-to-create-the-mansfield-relative-performance-indicator
“…
Mansfield Relative Performance indicator
The formula of this indicator is a bit more difficult than the regular Standard Relative Performance indicator:
MRP = (( RP(today) / sma(RP(today), n)) – 1 ) * 100
Where:
RP = Standard Relative Performance indicator (see above)
SMA = Simple moving average over n days.
n = 52 for weekly charts, and n = 200 on daily charts
So to make it a bit clearer:
Mansfield Relative Performance = (( Today’s Standard Relative Performance divided by Today’s Standard Relative Performance 52 Week Moving Average )) – 1) * 100
…”
Extract from: https://www.stageanalysis.net/blog/4266/how-to-create-the-mansfield-relative-performance-indicator
“…
Weinstein defines it as the following on page 18 of the book:
“How a given stock (or group) acts in relation to the overall market. For instance, if stock XYZ rallies 10 percent while the market moves ahead 20 percent, that’s poor relative strength even though the stock has advanced. On the other hand, if stock XYZ declines 10 percent while the market averages decline 20 percent, that’s favorable relative strength even though the stock has moved lower. The formula for measuring relative strength is simply the price of a stock ( or group average) divided by the price of a market average.”
…”
Thanks for that instructive information Patrick. It makes sense and I like how you have applied it to silver. I wish there was a way to get an alert when the MRP breaks out above the trendline signaling when to get in. I’ll have to look and see if TradingView will do that. Great job on the charts by the way!
Thanks Banimal. Yes, tradingview can set the alert. Click on the + when you hover over the right axis. I love tradingview!