Gold’s Power Moves.
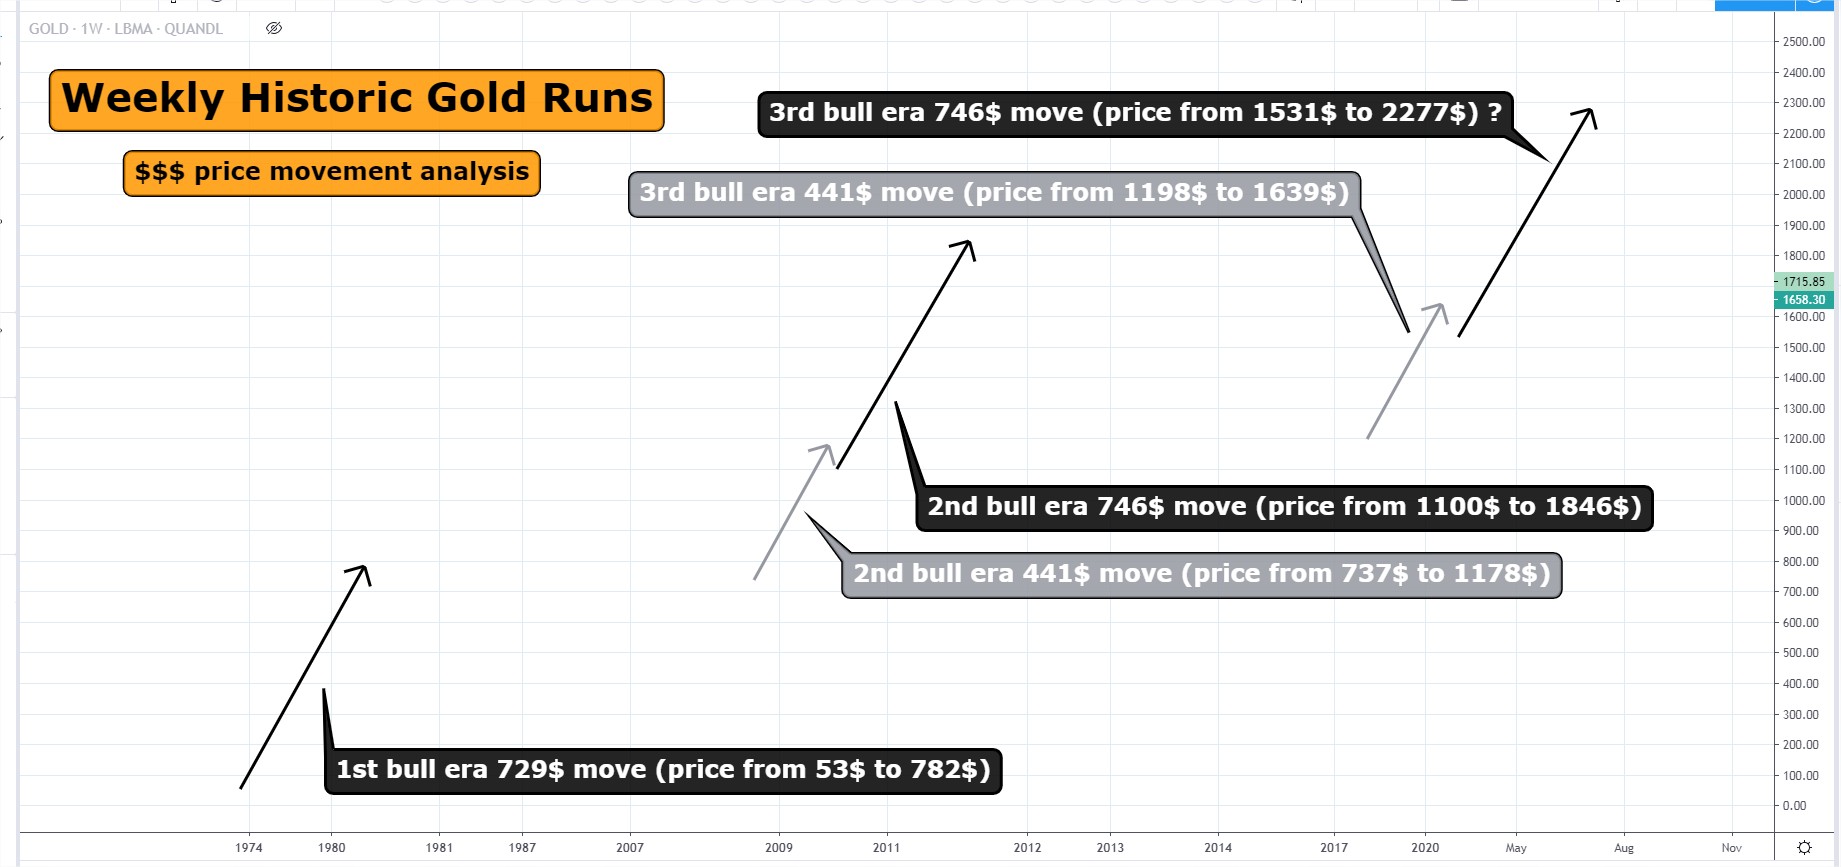
Forget % moves… this exercise is $ amounts. How much gold moves in $$$ before running out of steam…
Oddly enough… golds bull eras share the same amount of price movement when measured in nominal usd.
Here is the magic behind the chart… Renko! Removes time noise. Linear… no adjustment for inflation.

As you can see.. the split in the 2nd and 3rd bull era is the 2008 crash and the 2020 March Madness.
We have already entamed the run to +2200$… maybe there we will have a severe pullback?
Edit. Adding a thought… 1st bull era had 1 renko rally.. 2nd bull era had 2 rallies… maybe 3rd will have 3? So a run to 2200$ then a run to +3500$?
Love this! Very unique methodology.
Bueno!
Thanks guys. Not sure how usefull.. but I rather up targets than down.