Gold to Silver ratio daily Turning @111
GSR daily chart update as of yesterday close.
GSR is down from high of 130 to 111.
GSR reached highest RSI in decades last week which is not sustainable. A turn was expected. It has now. Watching it to set up lower high n lower low . Ultimately to break below 95. GSR exhibited same technical as SGR in 2011 at the top. Rest is in history books what followed.
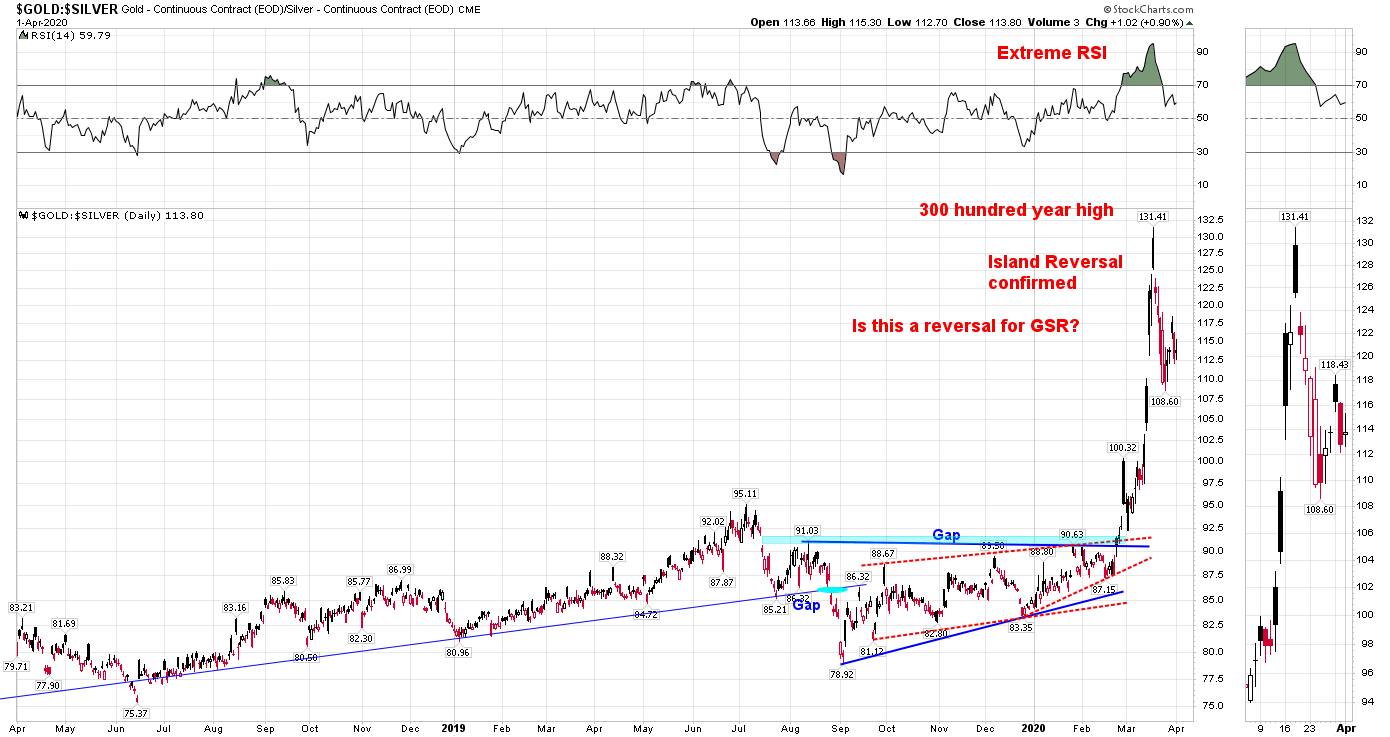
THREE HUNDRED YEAR HIGH !!!