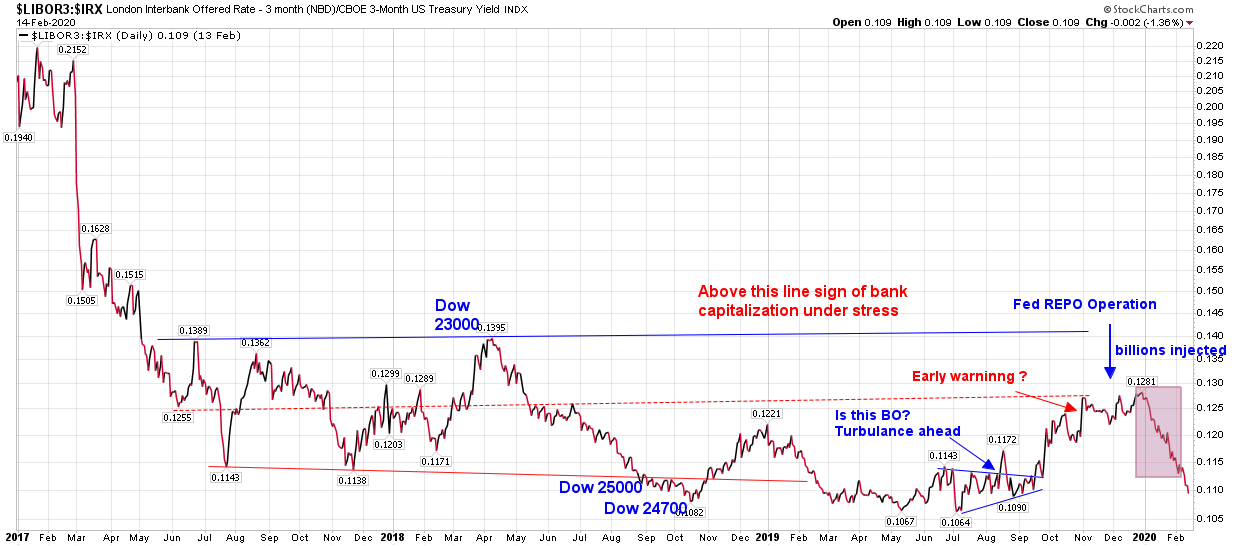
The Recession called “Repo” Libor3 to 3months T bill spread
Monitoring the ratio chart alerts market of liquidity in the market. One can see that last year ratio started to rise and FED stepped in with repo operation. Since then the ratio turned down and continue to decline.
“A simple chart will give us a clear picture of the aggregate of all operations the Fed has undertaken to stem the Repo Crisis by engaging first in overnight repos, then fourteen-day term repos, then longer repos than that, and finally in outright treasury purchases (again … and forever):”
“After several relatively uneventful reverse-repos to close off the month of January, which saw a gradual decline in submission, February has started off with a bang…. Ominously, the massive demand for term repo today means that the liquidity crisis that continues to percolate just below the surface of the market and has clogged up the critical plumbing within the US financial system, is getting worse, not better, and today’s massive over subscription indicates that one or more entities continues to face a dire shortage of reserves.”
Read More:
Previous post on the subject: