Warning!! Libor3 to IRX 3months T bill rate
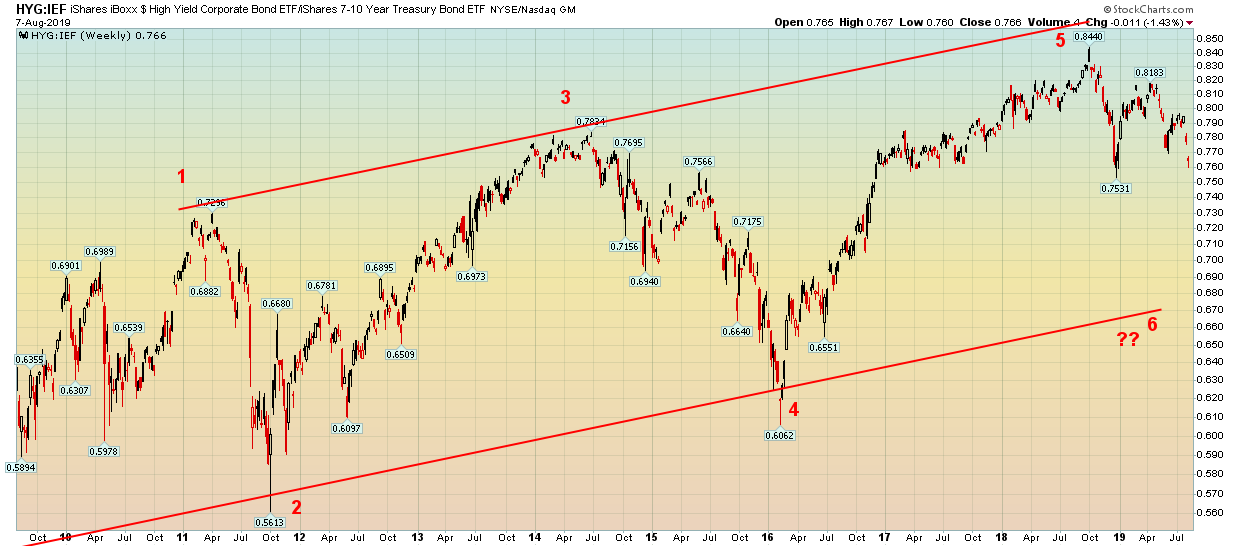
The ratio just broke out from a bottom triangle. Also credit spread has put in a confirmed HnS top.
From TSI Blog:
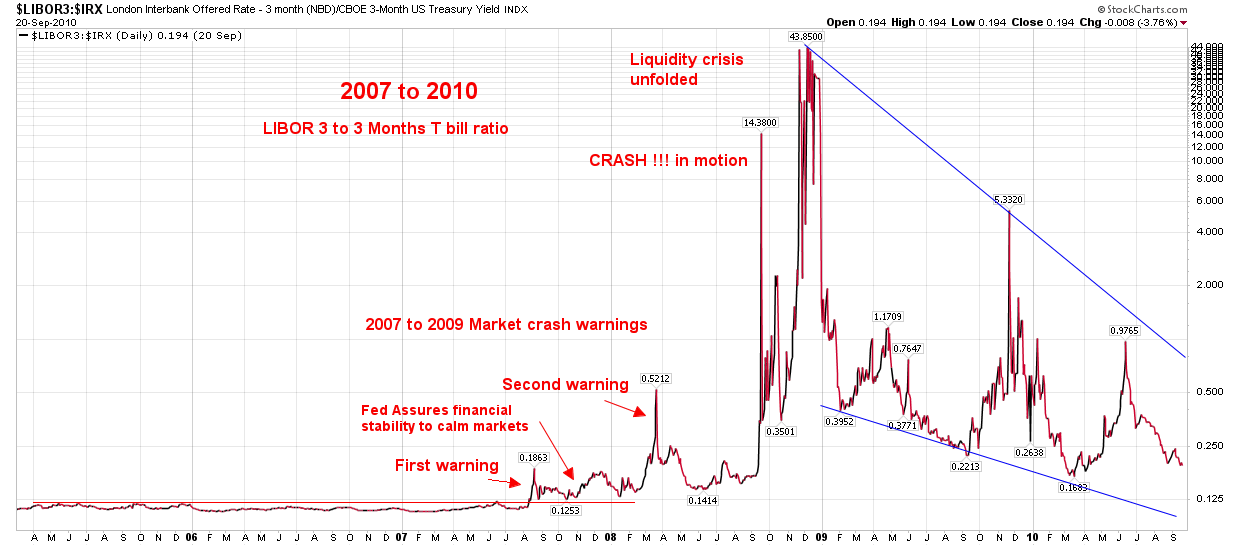
“The short-term interest rate at which banks lend to other banks versus the equivalent interest rate at which the US federal government borrows money, as depicted on the following chart by the LIBOR-UST3M spread.
When trouble begins to brew in parts of the banking system it gets reflected by higher interest rates being charged for short-term inter-bank loans well before it becomes common knowledge. This causes the spread between 3-month LIBOR (the average 3-month interbank lending rate) and the 3-month T-Bill yield to increase. For example, the LIBOR-UST3M spread was languishing at around 0.20% in early-2007, indicating minimal fear within the banking system, but then began to rise steadily and reached 0.75% in June-2007. This was an early warning sign of trouble. The spread then pulled back into July-2007 before rocketing up to 2.25% in August-2007. This constituted a very loud warning. After that the spread became very volatile and moved as high as 4.5% at the peak of the Global Financial Crisis in October-2008.”
https://tsi-blog.com/2018/09/there-will-be-warnings/
The ratio from 2007 to 2010 during 2008 crash warning as a proof:
Current chart:

Credit spread:
Thanks Bikoo…you are our early warning Captain !
Saved at Yields and Gold.
Looks like we have time before an event…but it’s comming
LOL! No credit to me Please. Credit goes to these indicators and chartology. Yes market has some time.
https://www.marketwatch.com/story/ex-fed-boss-greenspan-says-there-is-no-barrier-to-treasury-yields-falling-below-zero-2019-08-13