Quicker Than I Thought
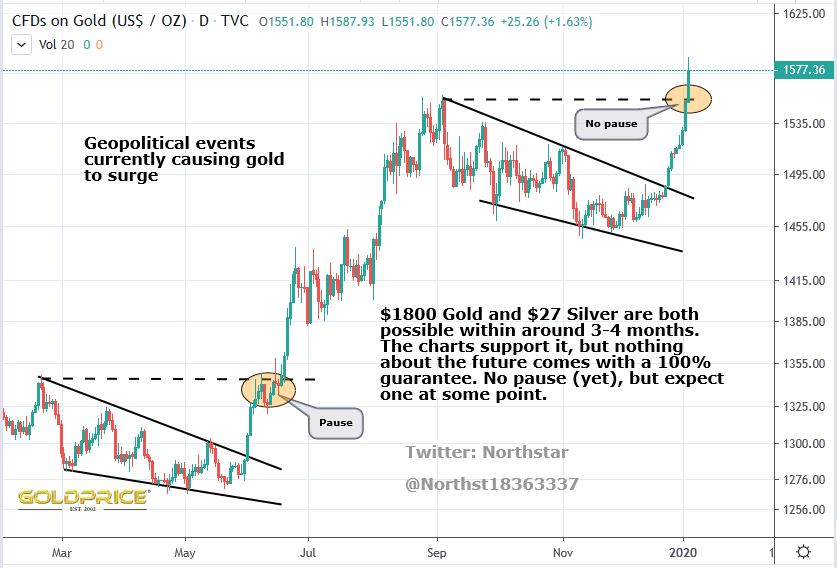
Gold is surging towards $1600 on geo-political instability. The possible/likely pause didn’t occur (but I’d expect a pullback /consolidation at some point). The chart told us this was going to happen, in no uncertain terms. We rarely know why, or specifically what, it is that will bring these future chart patterns about, but I try not to over think that. The chart speaks for itself. Case in point – why is the US Dollar Index going to fall below 90, below 80, and possibly below 70, instead of surging to 100, 120 or 160 ? I’m not going to over think that either. The chart is telling us that a Dollar plunge is far, far more likely than a Dollar surge. Until, or unless the chart tells me otherwise, that is the current forecast (from me at least).
My longer term view has been, and remains that $1800 Gold and $27 Silver are perfectly possible within 3-4 months. Not guaranteed of course, but the charts do support that outcome.