The not so thin red line on gold.
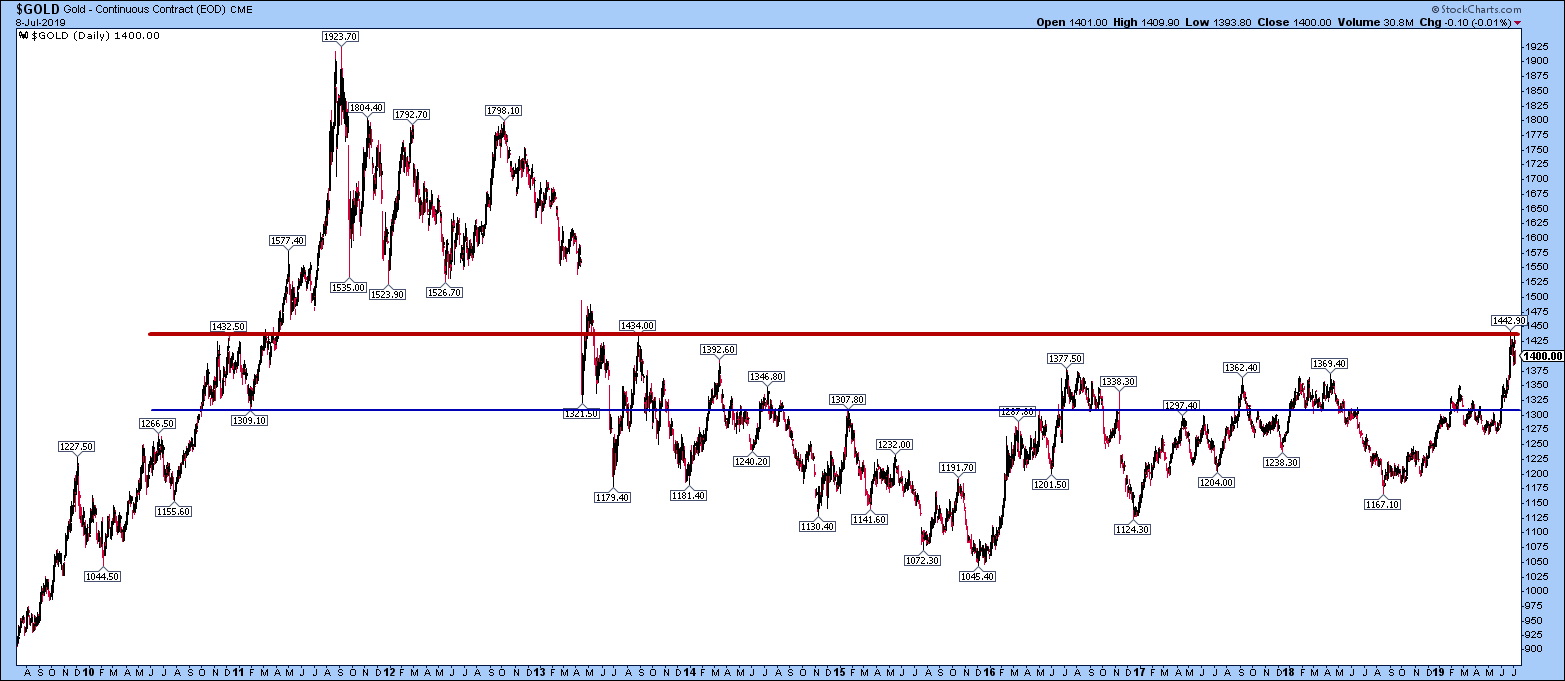
Bob is $15.00 dead. Poor Bob. His yellow friend is stuck under the not so thin red line. It took yellow friend basically 6 years to get above the thin blue line, $1309, a mega important level in my humble opinion. So do we really expect the thick red line to be broken in a few weeks? Reverse symmetry might suggest it’s possible but is there reverse symmetry? It’s not so clear. Reverse symmetry might actually suggest a very nasty correction to match that $1320 or even the $1180 support in mid-2013.
Would “realism” point to an immediate breakout? Anyway there hasn’t been a good, positive re-test of $1309 on the way up that has held. That trading level also goes all the way back to early 2011.
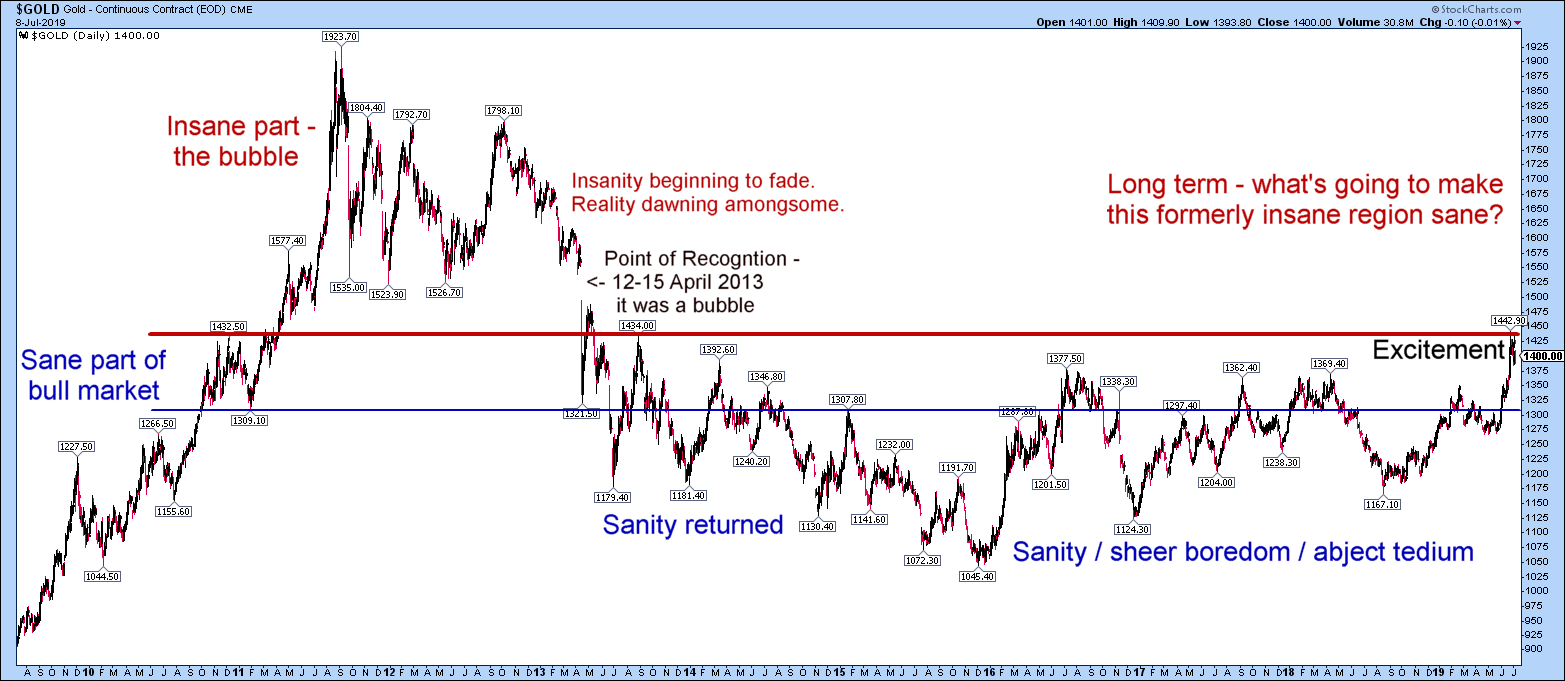
Now for some labels:
Meanwhile, here is an interesting ratio chart I first looked at this morning. Always good to get a perspective on things:

The last year’s action. Lots of gaps to be filled!!! I know, that’s facetious.

I don’t know about your thick red line Dave
It only has 2 touches in the past so why is it so thick ?
Then there is that GAP calling… at 1500
Bitcoin has certainly outperformed gold as you so aptly show
$1180 would do what might be needed.
More bulls might have to be shaken off this ride before a bull move can happen. Every good bull but one that I’ve ever known is bullish beyond belief and ready to sell their houses to buy a yellow metal.
I don’t see all this bullishness,the majoriry of people thinks that this move will end like it always did,retracing all the gains it made until now.
Not to say that both silver and the miners have completely IGNORED this gold “breakout”.
Mamarae – look at gold globally. New all time highs in one currency after another. I live in the UK and can now sell gold coins for very close to new all time highs as well. Silver and the miners are in disbelief which is a very good thing. If this bull market is to be long lived and sustained, we need as many disbelievers as possible. Huge under investment in the miners right now, but with gold at $1500 or more that will change fast. Just look back at how fast the miners can gain 50%, 100%, 300% once the point of recognition is reached. I for one am very happy that point is still ahead of us, with pretty much every other global currency well into it’s PM bull market – it gives me more confidence that I’m on the right side of the trade. Gold just doesn’t do this if we’re about to go down the drain. Also remember that many miners are down 80%, 90% or even more. Buy low, sell high. We really can’t expect that much more downside.
I hope you’re right NS but this underperformance of miners snd silver makes me anxious…..
In the first 6 months of 2016 miners went to the roof with the price of gold at lowest levels of where is now.
But let’s keep on wait….hope is cheap 🙂
I meant lower