Nasdaq 100 vs Gold: 45% Upside for Nasdaq if Gold Falls to 666
Excellent Goldtent thread from Parabolic Chuck in which we learned that the monthly closing high in the 1980s for Gold was 666.75. This resulted in some spooky speculation that Gold could bottom at 666 within the next decade.
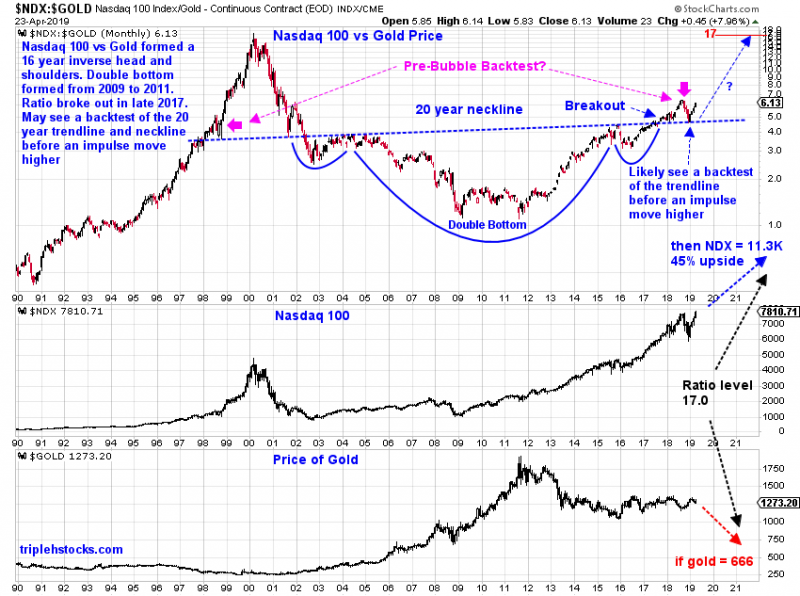
A Gold price bottom at 666 wouldn’t be so bad for investors who are long the Nasdaq 100 instead of Gold. In honor of the Nasdaq 100 and S&P 500 making new highs again, here’s an update of the long term Nasdaq 100 vs Gold ratio chart. We see that we are in a possible “pre bubble backtest” phase before an impulse move higher to possibly retest the year 2000 ratio peak of 17.0. If Gold falls to 666, and this move coincides with the NDX:GOLD ratio increasing to 17.0, this implies a target price of 11,322 for the Nasdaq 100, which is roughly 45% upside from current valuation of 7,810. -Harry
Harry….2 things
1…..Nice Ratio Chart…looks ,like there is another gear for Stocks vs Gold
2……When you say Gold 666 here please don’t sound so gleeful. That would be very painful for most here financially and emotionally and bankrupt some !
Not everybody wants to buy Tech Stocks.
But your point is noted
Yikes indeed! Thanks for the feedback, Fully!
Wow. Thanks for the shout out Harry, and I love the chart.
That’s a pretty clear H&S breakout and backtest.
Thanks for sharing.
Fully,
Harry very well could be helping a lot of the readers here not lose a lot of money if this really plays out with the stock markets up and gold down. This would make your site much more valuable to many…
The site is valuable to anyone with an open mind and we always encourage honest TA
However it IS a Gold Site first and foremost…. and to just make calls for Stocks to go to astronomical heights and gold to fall to depressing levels…. and not realise what that implies for many here who are committed to Gold no matter what ….is being insensitive to a large contingent who frequent Goldtent .
I know Harry understands , but I think maybe he forgets many here are NOT happy about this prediction …and would have a tough time buying Tech and Selling Gold.
Goldophiles are NOT wired for that.
IF Gold drops that far… this place will be a morgue. Period !
Fully I believe I recall you giving praise to a certain individual regarding calling the 2011 top who was subsequently ridiculed on another site because of it in real time? Not saying I agree with the above thesis but I come to this site to hear all views/opinions regarding gold and related topics to sensor posts on your site to shelter someone’s feelings is that a direction where the your tent wants to go?
I don’t agree with a lot of points of view on this site but value all posts equally and appreciate such contributions……
Maybe you need to read my comments again.
There is no hint of censorship , “We welcome all opinions.”
MY opinion is….. IF this scenario plays out it will hurt a lot of people here.
And I wanted Harry to be aware of that . This scenario like all scenarios is entirely possible.
But given that this site is primarily read by Folks who are invested , financially and emotionally in Gold
it is good to be aware that this scenario will cause damage and to be sensitive to that.
From his response he “gets it”
So all is well.
Yup I get it! For the good-will of Goldtent’s readership, we can celebrate the instances where the PM complex successfully “fights the FAANGman”
The same ratio analysis above can be used to find Gold related assets that do outperform tech stocks.
Good example is Kirkland Lake which has kicked Nasdaq a$$ for the last three years:
https://goldtadise.com/?p=442031
Anglogold Ashanti vs Nasdaq 100 (AU:$NDX) still looks healthy, like a correction in a bull market rather than a capitulation breakdown. We can discover and share similar opportunities as a community!
There is high probability for this scenario, for 10+ year bull market to make blow out top +30% in S&P and 50%+ for NDX, only thing is timing , will this be this year or early next year.
As the China deal is still pending , Stocks may pause for rest of the year after 5% up from this point all time high, will make blow up top early next year.
I can see short interest going up 200-300% on Retail, Semis, Oil equip etc, any positive news, will make stocks up on steroids. As the risk on trade in place gold may have tough time in short period.
We may see blow off top on stocks and final capitulation gold stocks same time, before gold price bottom.
Thanks Siri! Interesting to see which sectors are included in the next stock market blow off top. One key difference between the 2000 and 2008 peaks in stocks were the sector participation. 2000 peak was primarily lead by tech, while Real Estate and commodities were bottoming. It was possible to rotate one’s portfolio from tech stocks at the 2000 highs into the lows for Real Estate, Gold, etc. Whereas in the 2008 peak, seems like all sectors went up and all sectors were smashed back down. Could only escape with US Dollars and Bonds (Gold did recover from the 2008 crash but was also an initial victim).
Funny you mention 11k…check out channel boundary price. But, personally I dont think gold trades below 890 if a big drop is in the cards.
https://www.tradingview.com/x/DzT95LW5/
haha, I like the way you wrote 11k. Good find on that breakaway gap from 1998, 1999. Might see a similar gap up for NDX in the next bubble? 890 Gold means 15,130 NDX if that 17.0 ratio is retested at the extremes, better for my portfolio!
Thank you for a very informative chart. My advice to everyone here would be to watch that long term gold bull support line (somewhere just above $1220). I’m bullish until that line is broken. If it breaks on a weekly close basis this scenario is quite possible.
Good advice Northstar!
We all have to try and remain open minded. There’s nothing to be gained by having a closed mind. Key support just above $1220, key resistance just above $1350 (but let’s call it $1400 to be certain). A move beyond either of these levels will give us our answer.