There’s Always a Bull Market Somewhere
But there’s never a Bull Market in Gold
…..Fully
Here is an excerpt from the Comprehensive Chartology of Gold ( tonight’s Wednesday Report from Rambus)
https://rambus1.com/2019/04/03/wednesday-report-240/
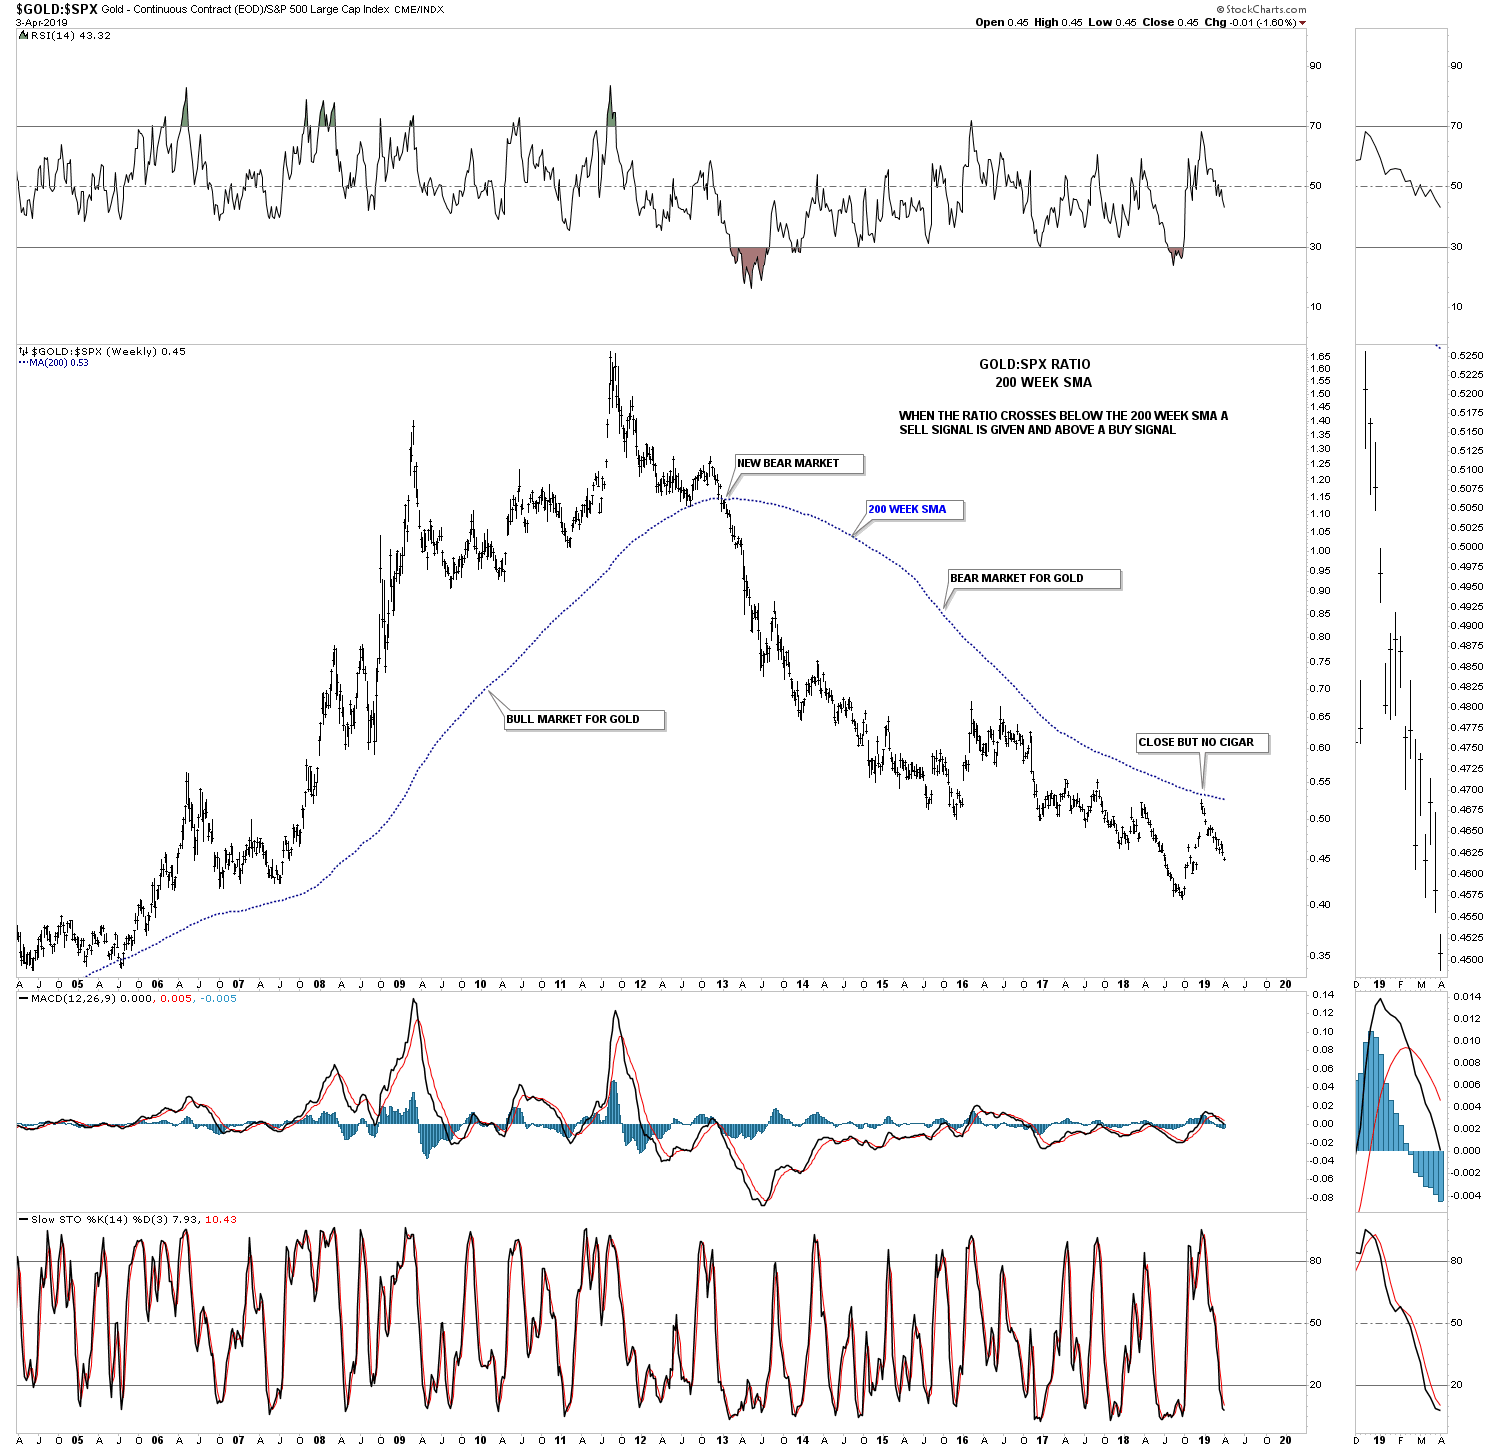
Below is another ratio chart we’ve been following which compares gold to the SPX which is moving in the wrong direction. Earlier this year the ratio came right up to the 200 week ma but failed to breakout which would have confirmed a new bull market.
This last chart for tonight is one I haven’t shown you before. The green shaded area represents the first trade I made shortly after the necklines were broken to the upside. The right side of the green shaded area is where I exited those nine trades that were all winners but were just singles. With the 3 X leveraged trades I expect much better results. This is also a good example of what I discussed in the last Wednesday Report when I wrote about, ” you never go broke taking a profit.” This is what can happen when you get out too early. We did get a small decline after we got out but, I was able to get back in for the most part but it took nerves of steel to go back in. What is happening now is that most of the US stocks markets are completing their February trading range with many breaking out and several testing the top rail of their small consolidation pattern.
The point of this Wednesday Report was to show you that the PM complex could still chop sideways for a period of time which may be frustrating for most folks. On the other hand the stock markets are in a strong move up since their late December low which is a nice place to be right now. For me personally I’m an equal opportunity investor. Give me a good trend and I don’t care what its in as long as the trend is strong. All the best…Rambus
CLICK 2x

Yep, the excitement is elsewhere at the moment. Cryptos are about as volatile as Uranium, making it hard for me to recommend. I kept a small position after getting out last year just after the bubble peaked (Bitcoin and Litecoin), and both are up over 100% in the last few weeks. It wouldn’t surprise me if they fell 100% just as fast lol.
Gold is in bull market since 1999 low $255. Miners are not in bear trend and the ratio of Silver to gold is bear trend.
Is Warren Buffet wrong??? Buy the hated assets. How long miners arre going to be hated????
Thanks.
How do you not know that after touching the 200 MA – the ratio is building out a bull flag ? Just a thought
Welcome Todamoon
Well for starers Bull Flags usually start on a flagpole.
No flagpole on this chart unless you squint real hard
🙂
I actually see the possibilities of two things – a bullish flag or an inverse head and shoulders with the right shoulder forming at the moment