Stick To The Facts…
… and you can’t go too far wrong. It’s when you start to look at views and opinions that things start to go wrong. As a scientist, it’s only the facts that I believe. Anything else is debatable, especially when it comes to trying to predict the future. My career in weather forecasting has taught me that. So how does that apply to the PM markets ? Well, actually, there is a very strong correlation. Many things in the natural world have a cycle. Cycles usually change in a slow and predictable way over time. They can slowly extend or shorten, or indeed tend to become more or less energetic. In scientific terms, the amplitude and wavelengths of the cycles can vary. I hope you’re still with me. That works unless/until there is a paradigm shift. What’s that ? if there is a sudden (often unforeseen) shock to the system, then your ‘predictability’ goes out of the window until a new pattern, or cycle emerges from the apparent chaos. In my field of expertise, this is what happens during an Ice Age or rapid global heating event. Eventually the Earths feedback systems (oceans and ice sheets) play their role in locking up or releasing heat energy, thus returning a balance of energy.
It appears to be much the same with global financial markets. I think we’re probably all familiar with the business cycle (a quick ‘Google’ will help if you’re not). Here are some examples of cyclical behaviour…
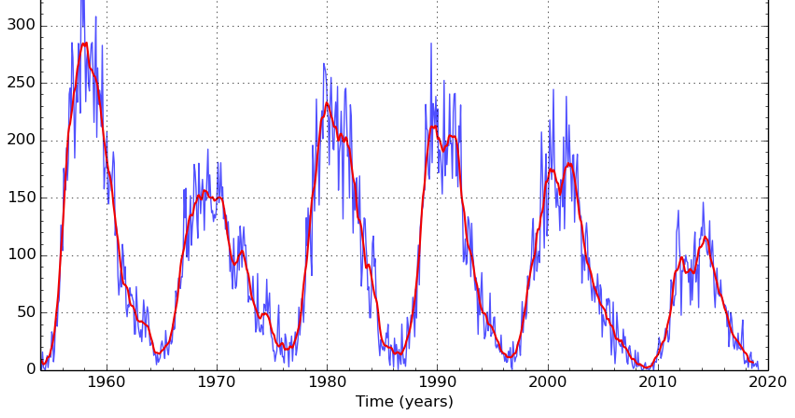
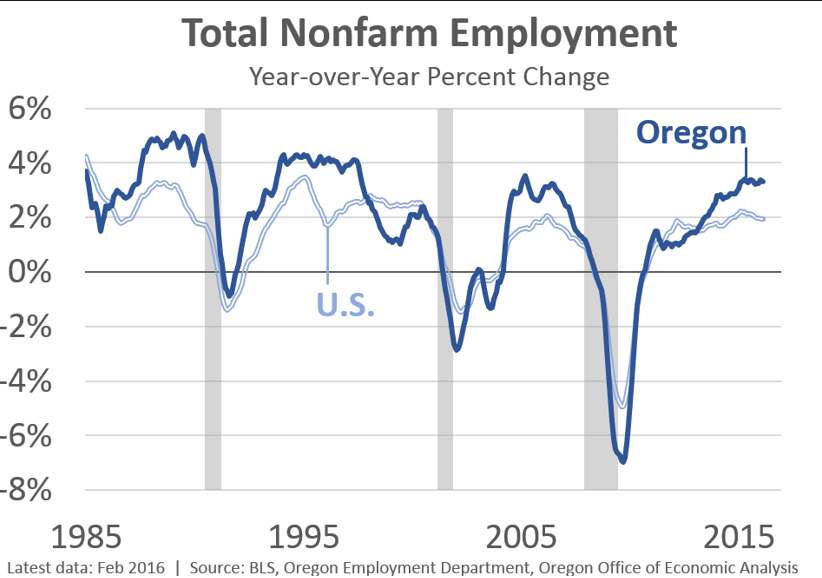
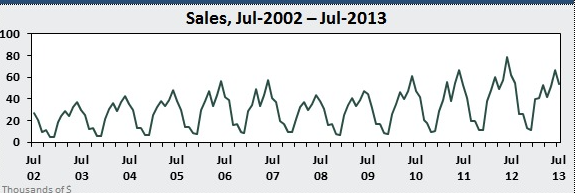
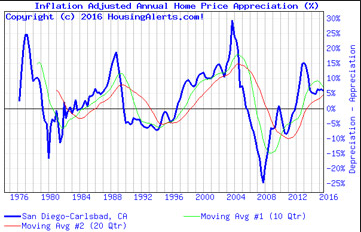
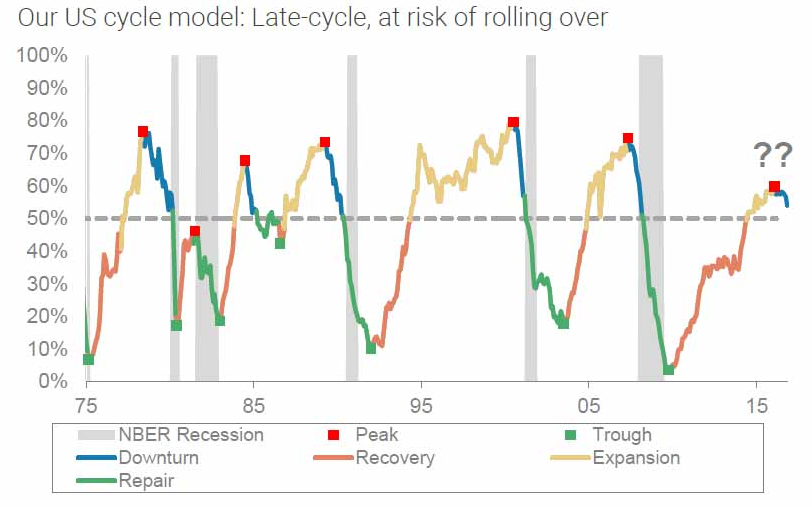
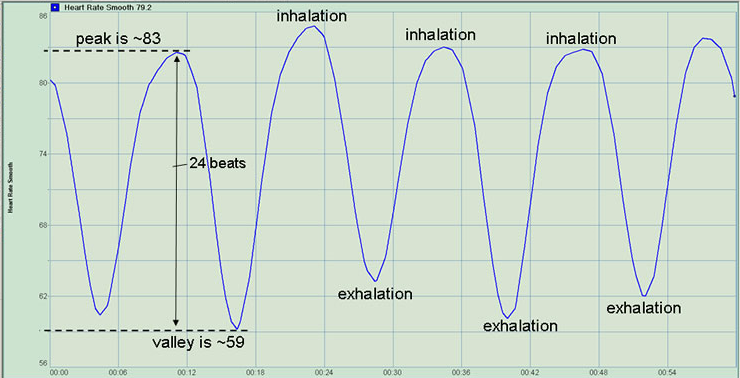
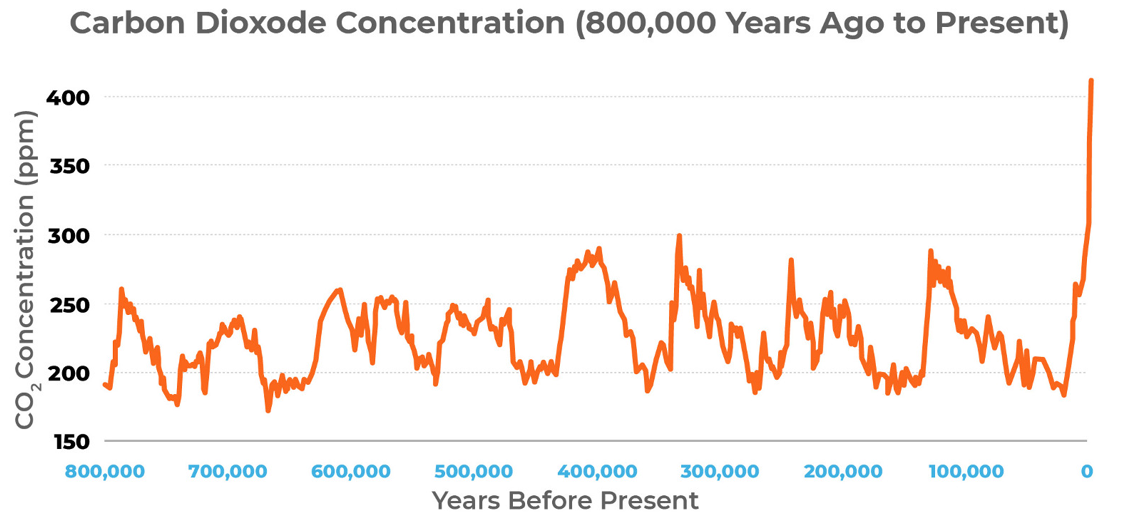
Sunspots, payroll, sales, real-estate, business cycle, heartrate and atmospheric CO2. The list goes on, but you get the idea. As a side-note, the last graph (atmospheric CO2) is somewhat contentious – it goes back almost a million years, using derived data from fossilised living matter to extract CO2 data. Many argue that the Earth warming and cooling is a natural process. It is. It’s also true that if you go back further in time the Earth had much higher CO2 (and other greenhouse gas) levels its atmosphere. Modern man didn’t have to contend with it though. The concern is that we may cause a ‘paradigm shift’. In this instance it could happen very quickly (100 years or less), giving us very little time to prepare. Anyway, that’s a whole different discussion. Back to PMs and sticking to facts…
The US Dollar has ‘floated freely’ in relation to gold price since the 1970’s and within a few years, things settled down, and the ‘heartbeat’ of this new paradigm established itself. Because the price of goods and services (in US Dollars) has continually risen over time, you would expect a graph of any commodity price to show 2 things. Number 1 – a trend from bottom left to top right. Number 2 – a discernible ‘heartbeat’ – what we all refer to as it’s cycle. In the financial space, this is a natural result of supply/demand and investment fluctuations. Here’s a look at gold…
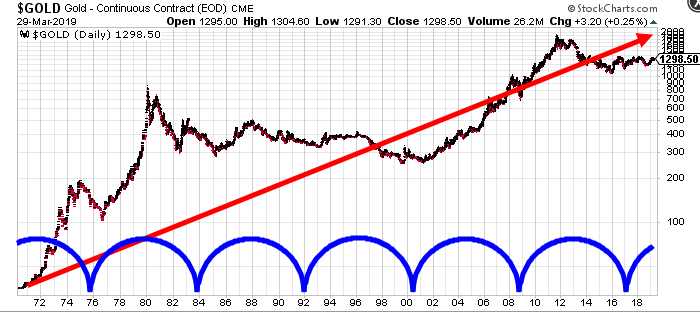
Theory seems to work fine then.
How about the Dollar itself ?
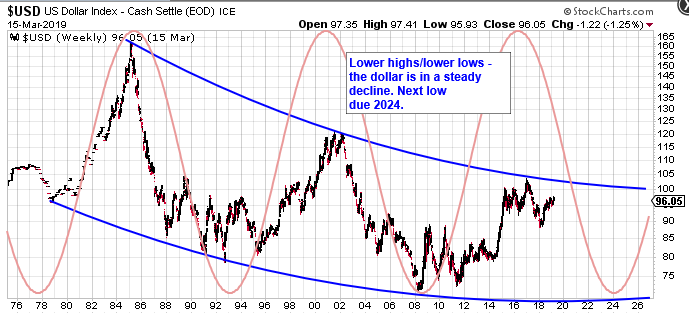
Exactly as you would expect with any FIAT currency. They are all losing purchasing power (see Dollar v Oil, Dollar v Gold etc) and trending towards precisely ZERO. The index shows relative performance v a basket of other currencies of course. The Dollars dominance is in decline (as with every reserve currency ever). The Dollars dominant position is demonstrably reducing. Lower lows and lower highs since the 1970’s means that unless we see a higher high (above 120) then the pattern continues, and the Dollar becomes less and less relevant on a global stage. How likely is 120+ with the Dollar heading into a cycle low in 2023/24 ? The Dollar cannot escape being worth ZERO. It’s simple mathematics. If you think otherwise, show me a long term graph of a FIAT currency which is gaining purchasing power.
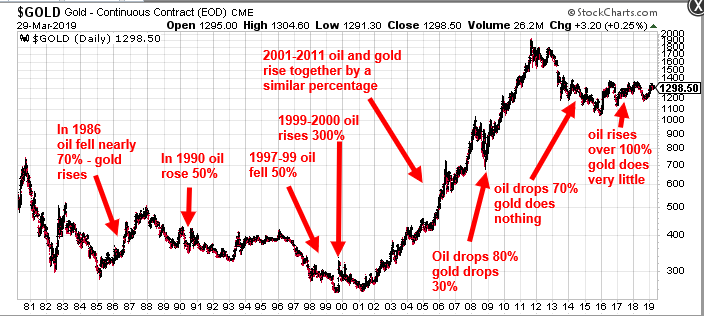
The Gold/oil ratio chart was interesting, but it tells you nothing about what the price of gold/oil is about to do. oil has gone up a lot, down a lot or nowhere a lot in the past when gold has moved very little. Here’s a gold chart, with some notes pointing out oils more notable moves…
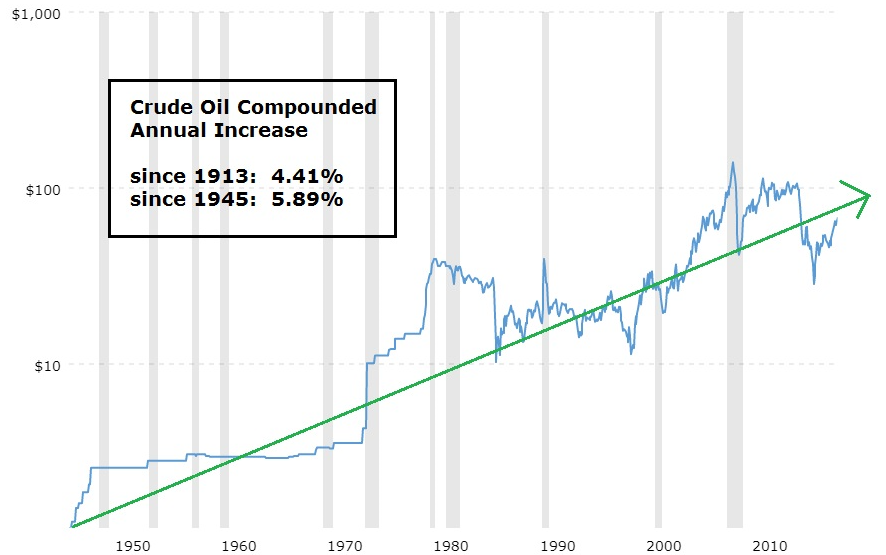
Here’s a long term chart of oil price. Like gold it is trending bottom left to top right (towards infinity) at the same time the Dollar is trending top left to bottom right (i.e. towards ZERO)
These are all facts (please comment and prove me wrong if you disagree – I’m always happy to accept a well proven point). Here’s something that isn’t a fact. The UK may be edging towards a much softer Brexit, with some form of customs union, a new ‘peoples vote’ and possibly even, no Brexit at all. All of these are likely to be very Euro positive. That would put downward pressure on the Dollar at a time when it’s moving towards a major cyclical low. Unless there is a paradigm shift, these patterns and cycles will continue. My game plan remains the same – watch that $1250 support area, and wait for the $1350 to $1400 region to be broken. Nothing is proven until then. Good luck all 😉
Lovely charts!
Nice theory. But will all such theories, when the facts change, so must the theory. The facts changed in the last 50 years when the currency market went completely off the gold standard, and ALL currencies became “FIAT currencies”. There is no money used in trade or ordinary financial transactions based on gold or any other commodity. (there have been weak attempts, but only by countries too small to matter) Thus we have entered into a new age of cycle theory, one that has yet to play out.
And if you look at the underlying fundamentals of dollar demand it seems pretty obvious that as soon as there is the slightest whiff of contraction in the air that demand for dollars is going to soar. What happens to the cycle then? WHAT loans will accept payment in gold/silver vs dollars?
You’re straying into the realms of speculation and opinion AP. Stick to the facts. The facts are as above. If any of the charts or anything I said isn’t factual, then demonstrate it. Otherwise, the pattern continues, just like in all the other cyclical charts I posted. You need a paradigm change to alter it. The paradigm change occurred in the 1970’s and the predictable, decaying Dollar cycle is a result of that. It would take a regime change to alter what is happening. No such regime change is looking likely in the next 10 years. The Dollar will still be the (decaying) reserve currency. The next tectonic shift will occur when there is a currency crisis. After that a new ‘normal’ will become established. That’s just how it works. Unless you can show me some facts that prove otherwise (which I would welcome).
NorthStar – you say to stick to the facts and yet you say “No such regime change is looking likely in the next 10 years.” That doesn’t sound like a fact, sounds like an opinion to me.
Here is a scenario for you. What happens if the dollar decays 10% over the next ten years and the other currencies decay 15%. Guess what? The dollar will go UP. Why? Because it is compared to the other currencies of the world. I think you miss the point that even though it decays, it is a comparative valuation. As has been said here before, it is the least smelly fish in the pile.
But the facts don’t support that Ken. Relative to a basket of currencies made of the US largest trading partners, the Dollar has been in a decline with lower highs and lower lows since the 1970’s. I agree, when I say ‘no such regime change looks likely in the next 10 years’ it is not a fact – it can’t be – it’s a statement about the future. So why assume a regime change IS going to happen ? and why assume that would be Dollar positive ? – that’s not a fact, it’s a supposition. It doesn’t change the fact that the Dollar has declined against it’s counterparts (relatively speaking), as shown by the DXY, for the last 50 years. Show me a fact to disprove that, or show me a fact that shows it will change. Anything else is pure supposition. Why assume a trend will change, with no evidence to support it ? By evidence, I mean definitive evidence, not a series of suppositions (there are always counter-views). In a closed system like the Dollar Index (a measure of one currency against others, where one has global reserve status), the top currency (Dollar), will, over time tend to lose its ‘top’ status. You can see that demonstrated by the fact that at each cyclical Dollar surge, it fails to reach the dominant level it did last time (160, 120, 104). Unless global players stop diversifying out of the Dollar, then, bit by tiny bit, the process continues. China, Russia, Iran, India etc are increasing moves away from the Dollar, not increasing moves towards it – that is a fact. The US has one of the worlds worst debt to GDP ratios (12th out of a list of hundreds, and worse than almost every country in Europe) – that’s another fact.
Again I would ask you to read Plungers PBC series listed on the side bar. The facts are we cannot escape it and it will truly be a world changing event.
The cycle that I see in gold is it tops out, then goes down/sideways for 21 years, then tops out again, followed by another down/sideways pattern. We are 8 years into this pattern, so the best I see for gold is sideways with a bias to the downside for another 13 years or so. Which is about how long the next depression will take to play out, except this time you cannot expect the future president to reset gold to a higher price to try and goose the economy. Or confiscate gold as well.
I appreciate your point of view AP, but that’s all speculation and no facts. I’m a scientist – I need facts to validate a thesis. My facts are stated above, but I need something more solid than speculation to form an alternative opinion. Where are the charts to prove the Dollar isn’t declining long term ? Where are the charts to show the big economies of the world are not diversifying out of FIAT Dollars ? Where is the chart to explain how the US can avoid rate cuts and bullshit ‘unconventional’ policies (because that will likely drive the Dollar even lower due to loss of faith). Where’s the chart to prove the gold cycle is down over the next 10 years and not up (as I suggest) ? I need evidence. This post bubble theory doesn’t wash with me. I see no evidence.
Right in your own chart!
https://goldtadise.com/wp-content/uploads/2019/04/Chart880GoldCycle-1.png
Gold rallies from 1970 to 1980, then goes down/sideways until 2001, then rallies again until 2011, then down/sideways until….????
This cycle has not completed, but based on the last cycle from 1980 to 2001 its not saying anything about a new gold bull market.
https://goldtadise.com/?p=441814
https://jessescrossroadscafe.blogspot.com/2019/03/crash-signatures.html
https://jessescrossroadscafe.blogspot.com/2019/03/stocks-and-precious-metals-charts_22.html
Thanks – a timely reminder. This time is not going to be any different.
Nortstar, since you are a scientific person, you surely realize that facts all are from the past, and ANYTHING to do with the future is speculation, right? Your assumption that the trend in the dollar will continue is not a fact. Trends work until they don’t. If you want to talk in strictly factual terms, then we can only talk about the past. Do you agree?
My point is that observations are fact. The cycles exist – fact. I need a reason (proof) to believe they will fail this time round. There is nothing I can find to suggest that. If gold breaks out in USD as well as other currencies, we will know for sure.
Understand, however suggesting the cycles will continue is not fact – just prediction. You got after people for not sticking to facts.
Hi Ken. What I’m saying is that a cyclical market doesn’t just stop being cyclical. The cycle always continues unless the market is destroyed or you enter a new paradigm. I assume you’re not suggesting Dollar collapse, so that only leaves a paradigm shift which is a radical idea. I’m just suggesting the most likely scenario is a healthy continuation of the cycle until or unless the Dollars status as world reserve currency is threatened.
I understand Nortstar. I think a lot of discussions on this board get confusing because people talk in different time frames. I am not saying that the dollar has no cyclical nature, I am saying that it is not consistently repeatable as it has been in the last few cycles. We have been very lucky to have such repeatable patterns lately and I dont think our luck will play out a third time. Patterns are not a perfect science. If they were, all pattern followers would be wealthy beyond imagination. The markets dont make it that easy for us.
Thx for sharing Northstar!
My underlying motivation is to make sure less experienced investors understand that patterns do indeed fail and the next cycle being repeatable (and profitable) is not a slam dunk.
Fair enough Ken. There are many, many investors who are completely unaware of cycle behaviour unfortunately. How well this cycle behaves does remain to be seen.