Does This Chart Keep You Awake At Night ?
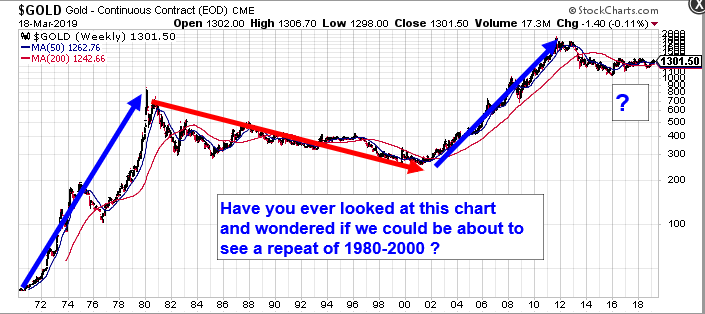
Well, maybe that would be a bit extreme, but I just thought I’d explain why I don’t think it’s anything to worry about.
For those of you who don’t think the Dollar Cycle is likely to repeat, this won’t help. However, this is my explanation. Look at 1988 on the chart above. Here it is zoomed in…
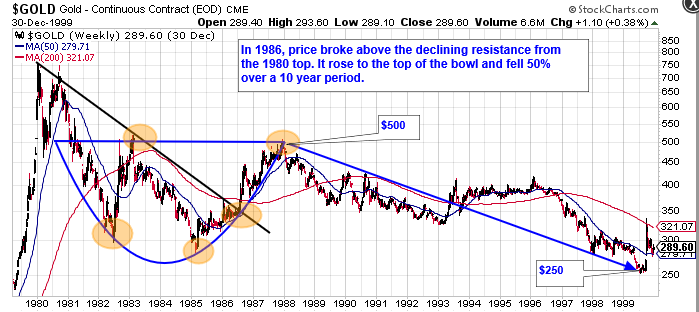
Now lets compare that with where we are today…
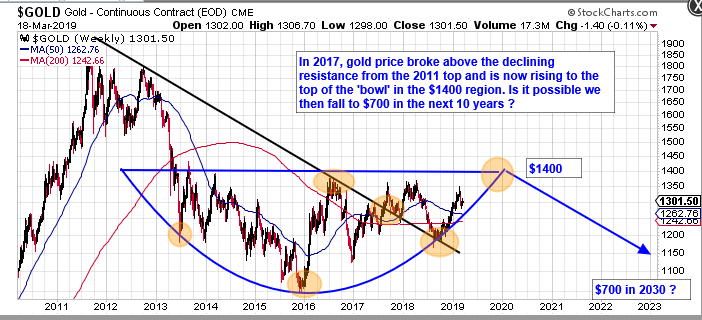
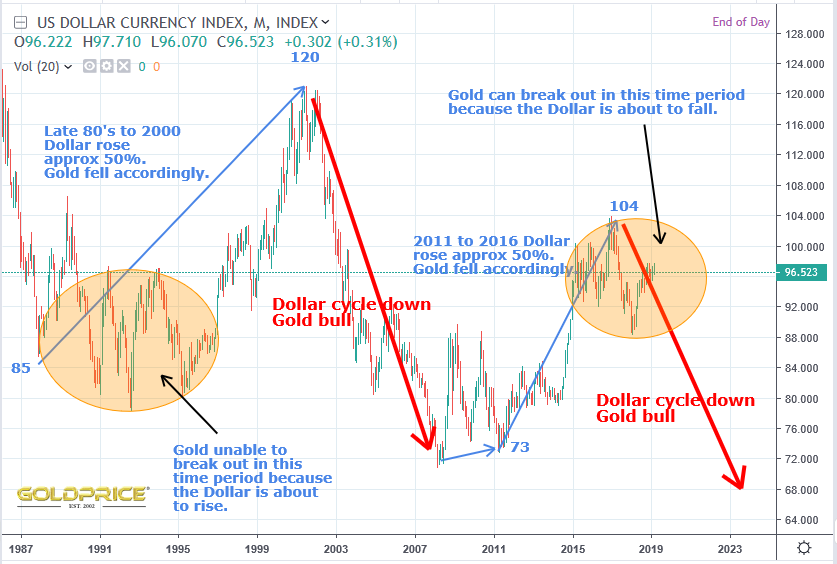
Remarkable similarities, I think you’ll agree, but here’s the thing. Just as gold looked ready to make a bullish launch in 1988, it flopped, and fell 50% in 10 years. That’s 10 long years of losses for anyone who held on. Why ? Cycles. They all run alongside each other, intricately connected. Supply/demand plays a part, but large fluctuations in the currency index will play a huge part, especially if it were to rise by 50% for example. Which brings us to the Dollar Index. Cutting to the chase – where were we in the Dollar Cycle in 1988 and where are we now ?
Two chart patterns – 1980’s and today. Both look very similar. Both look bullish. One couldn’t achieve it’s potential, the other can.
Yes to the first question
This one too
http://schrts.co/JDACiTzF
I can see the possible H&S formation, but given the other opposing factors, I don’t believe that will play out.
Looks like a cup-n-handle to me.
It could play out that way.
Of course, my explanation only works if you believe (as I do) that the Dollar is heading down to a cycle low in 2024. Another 10 years of a rising Dollar Index seems incredibly unlikely to me.
Well, in EW terms, both are 4th waves.
The 1980-2000 move was a triangle, ahead of a fifth wave parabola top (of Cycle III).
The current correction, in my thinking, is at higher degree (IV), but it will likely be a zig zag (ABC) so it will not take as long, but should produce a sharper ending decline.
Like the ‘$700 in 2030’, but I have sooner as the political pressure on DC Fools and Eccles hand maidens to ‘Do Something’ will come faster.
I’ve been saying all along that we are in for years of slowly declining gold prices. A 21 year bear market the first time around, a repeat the second. I see nothing in the fundamentals to drive the price higher. Gold would have to breakout of the upper resistance of ~1350 (the declining trendline of tops since 2013) on very high volume to convince me a new bull market is here. So far its been unable to accomplish that. Each high since 2013 has been lower than the previous. This is not indicative of a bull market pattern. More like a consolidation.
One thing we agree on AP – nothing is proven unless we break through the $1350-$1400 region convincingly.