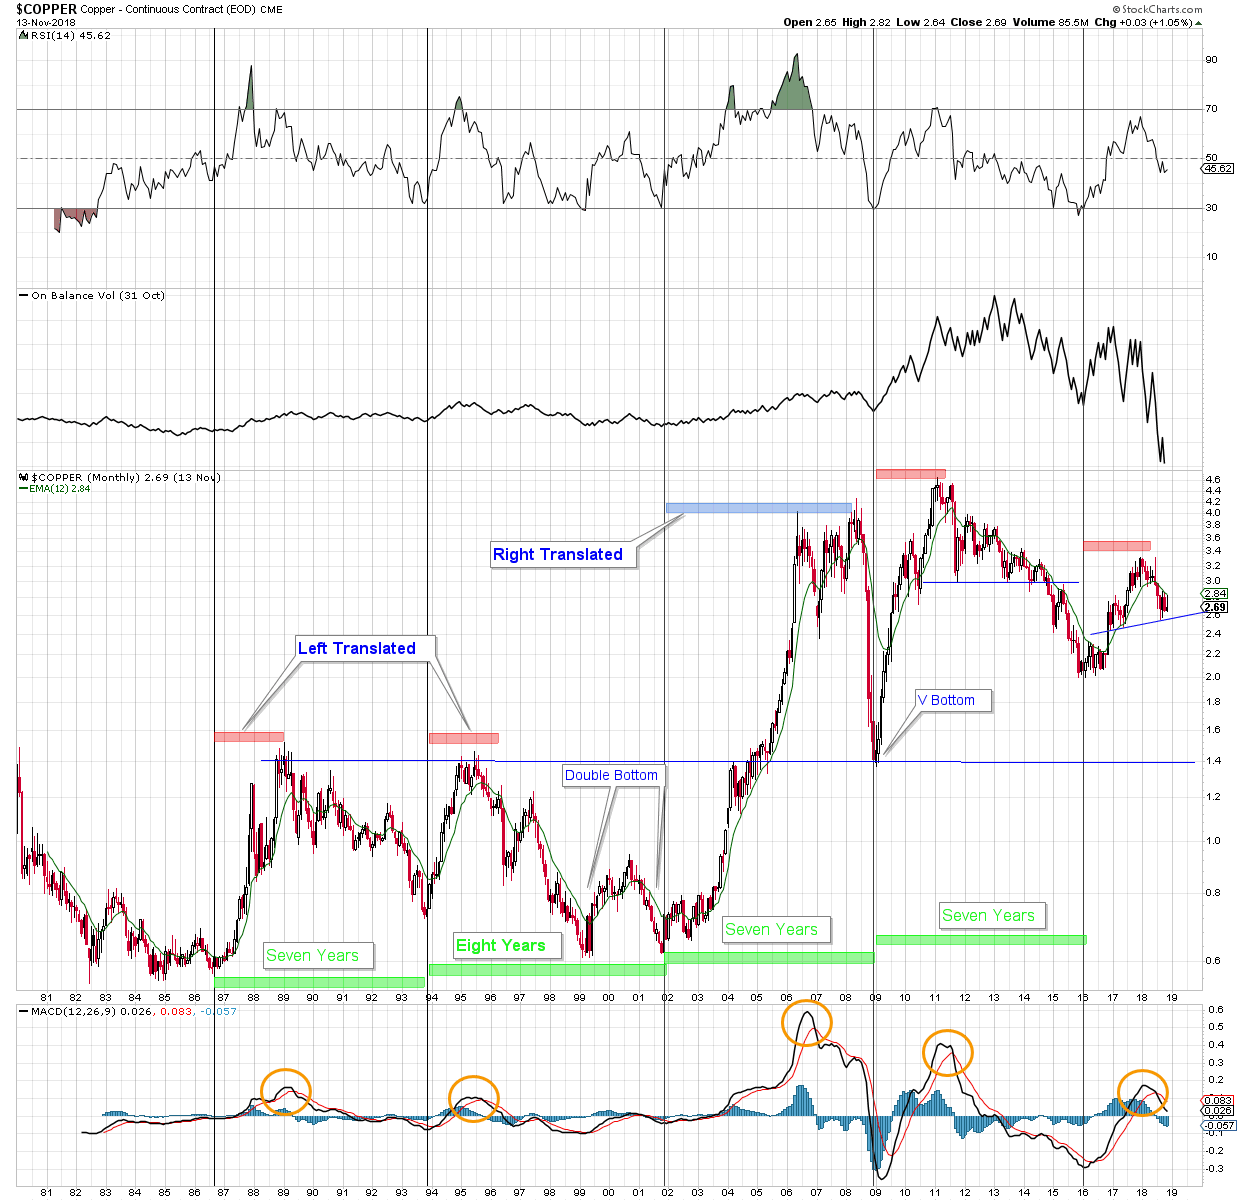
Dr. Copper – Monthly
Its called Dr. Copper because its said to have a PHD in economics. Here is a monthly view of the $price of copper from 1980 to present. It seems evident that the price moves in a 7 or 8 year cycle, trough to trough – or at least it has for the last 4 cycles. Three of the cycles were left translated (LT) – that is, the price rose for a shorter length of time in the cycle than the decline. In the 3 LT examples the price climbed for about two years, then gradually declined to the 7 or 8 year low. The outlier is the right translated period from ’02 until ’09 when the price climbed for 6 years and then collapsed into the 7 year low.
That brings us to the present cycle that started in January 2016. The question is – has the price of copper peaked? For clues we might look to on balance volume (OBV) as compared to the previous cycle, and to MACD as compared to all previous cycles. Both suggest copper has already peaked at year 2 and is declining into a cycle low due in January 2023.
$Copper Monthly
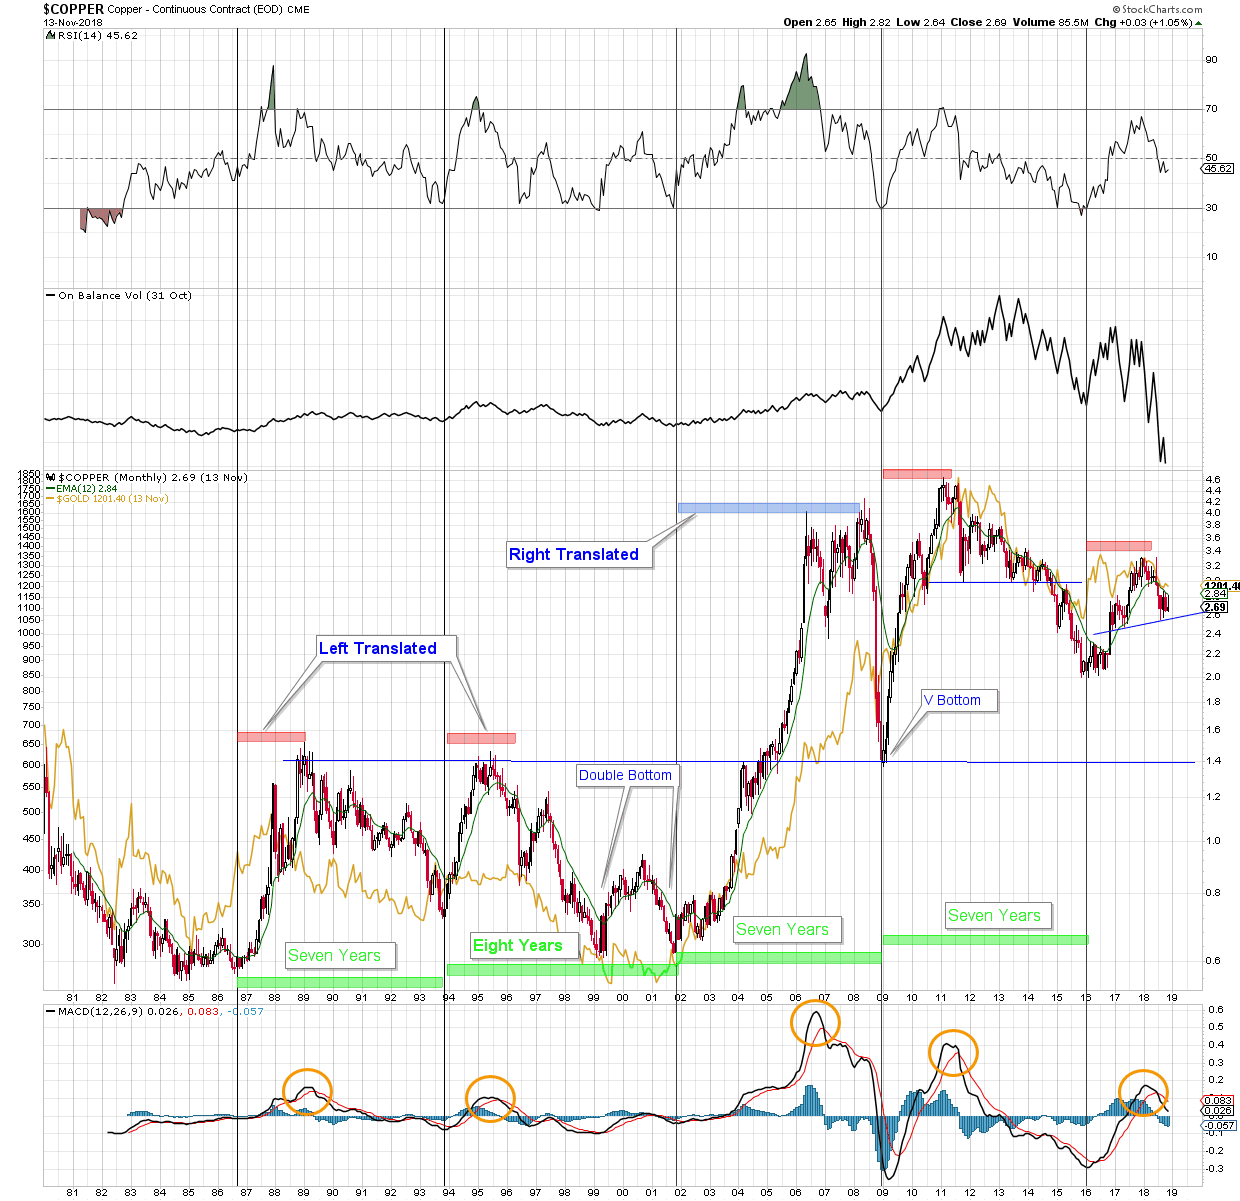
$Copper Monthly with $Gold overlay
What is interesting, and perhaps a little unsettling, is the correlation with the $price of gold. Its not perfect, but there is a correlation.
Thanks SF. I’m going to give this some thought.
I’m a huge fan of your work, NS.
A couple of points…
-even though $Copper may have already peaked (if it has…) the price can still move sharply back up toward the old high and
-the correlation with $Gold is not perfect. Gold, the miners, and copper have wiggle room.
As for a new high in $Gold within the next few years, I just don’t know. To me, just now, it seems unlikely.
…that is, a new all time high seems unlikely.
That’s precisely the time i’m watching fox. My work shows the commodity bull wont be in full force until 2026-2036. But I do think we have one move up in everything to make bigger 4th points in monthly charts.
Its those doggone market turns that one wants to catch, and catch early. Please keep us in the loop with your thoughts, Schism.