I think we go down before we go up…
Didn’t want to say it, but that is the way this chartist is seeing it right now. He’s why. Many of the leading stocks are displaying negative divergences to price with the RSI, MACD, TSI, and Stochastic oscillators which, by the way, are all trending down. At the same time many of these stocks are showing potential double tops at resistance. That’s a hazardous combination.
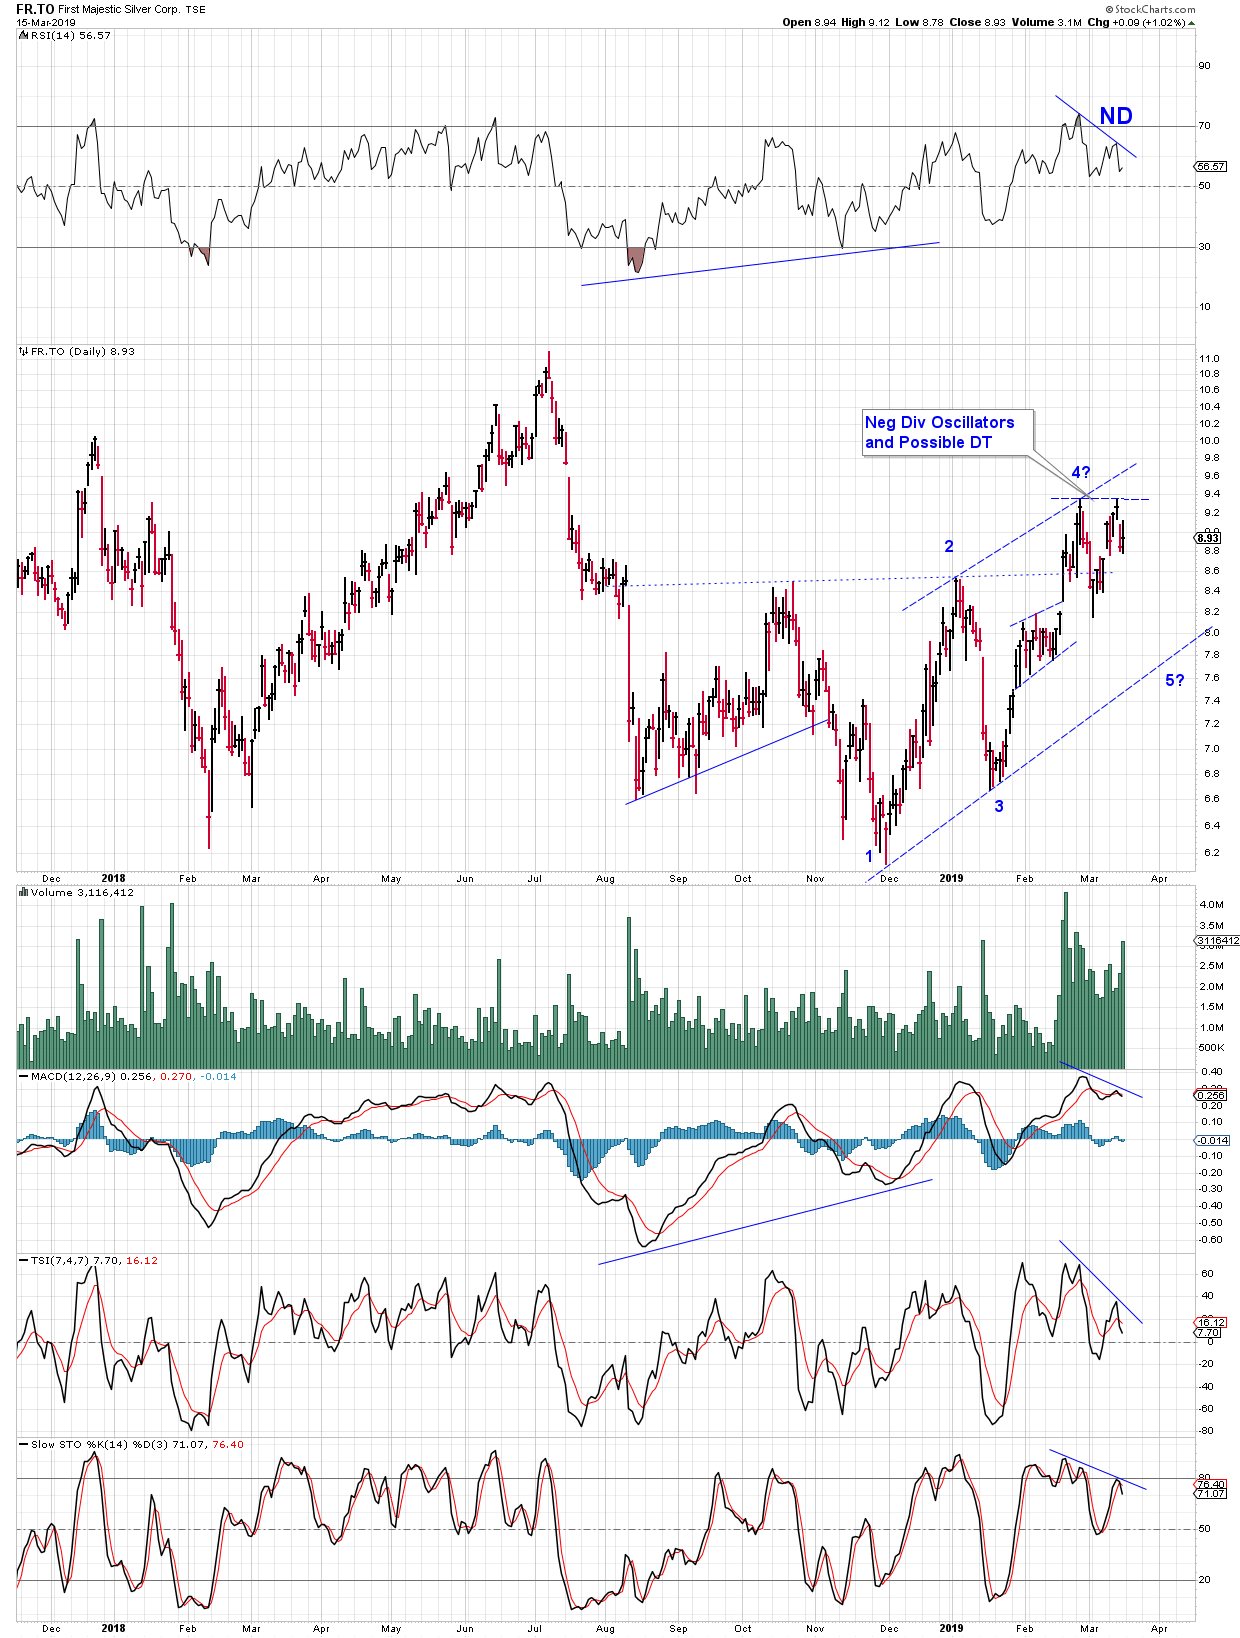
First Majestic Silver FR.TO Daily
If the DT is in play, the lower trend line may not hold.
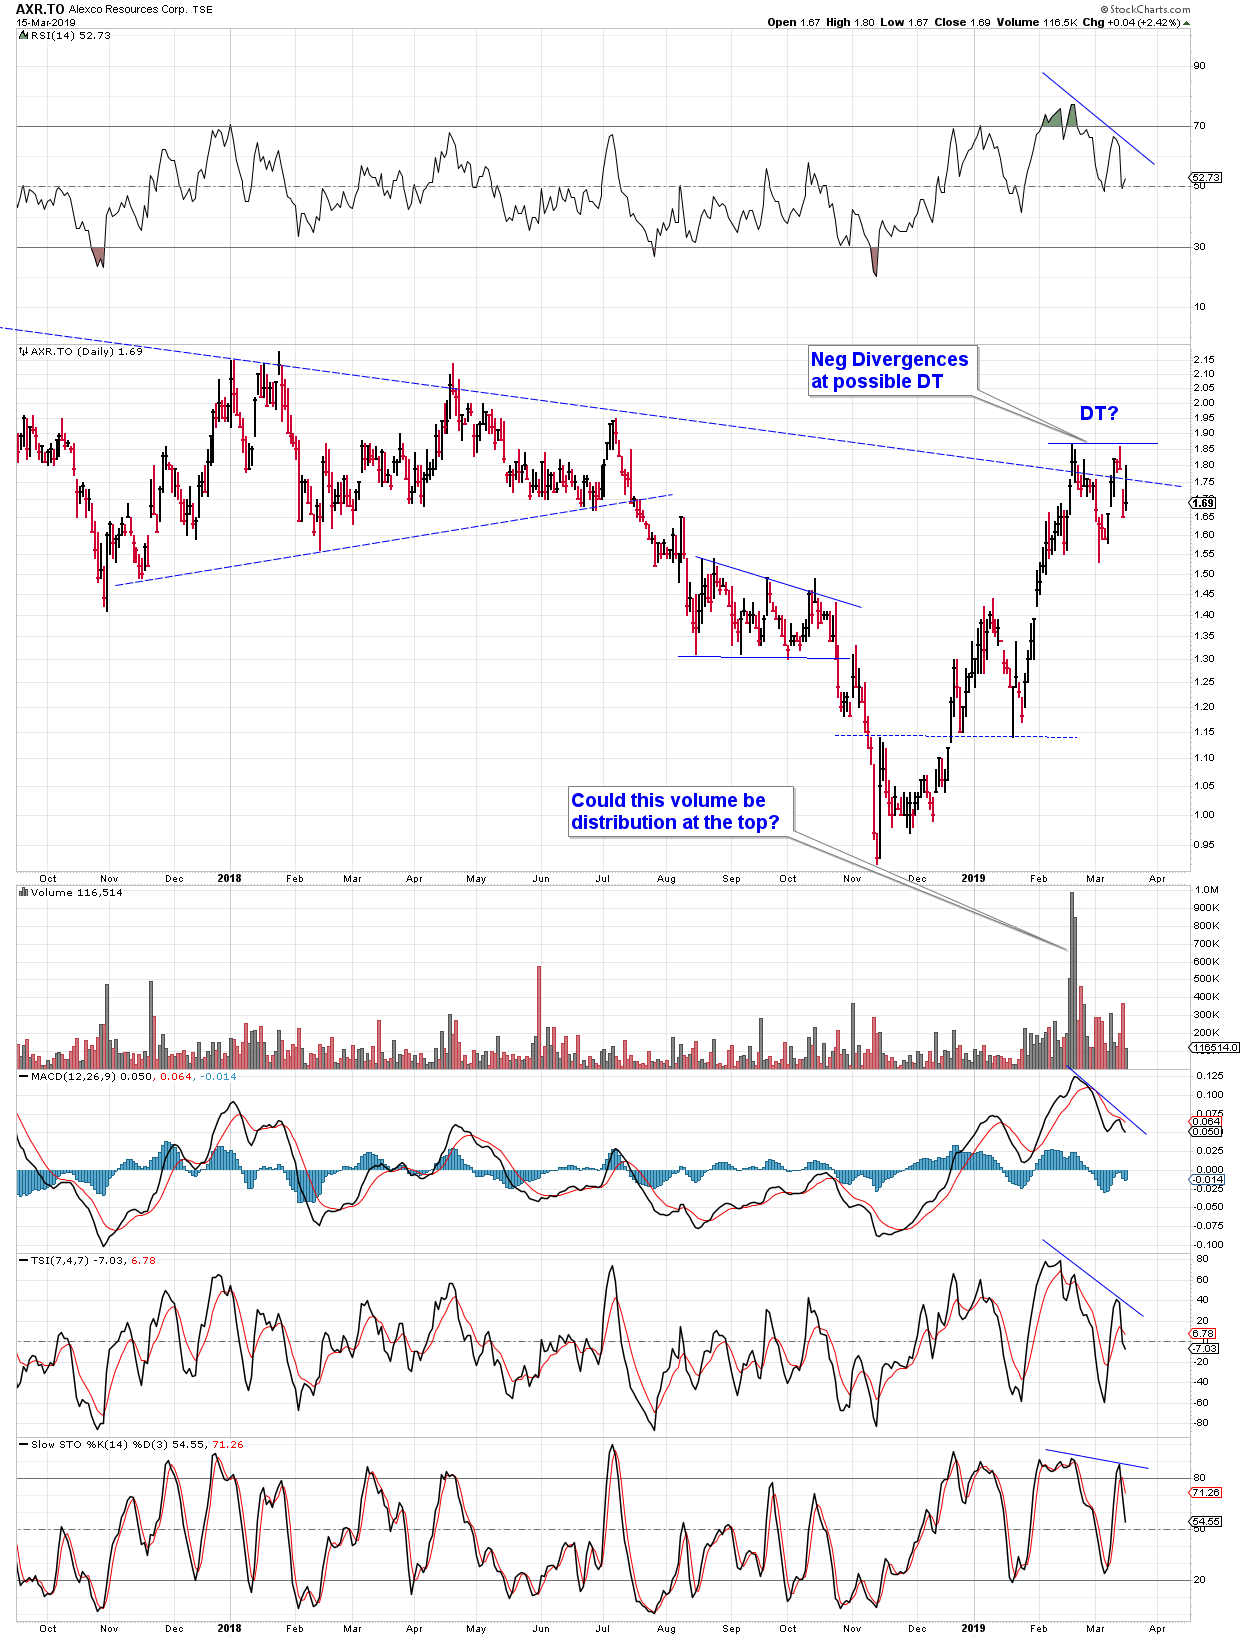
Alexco Silver AXR.TO Daily
At weekly resistance (blue dashed trend line)
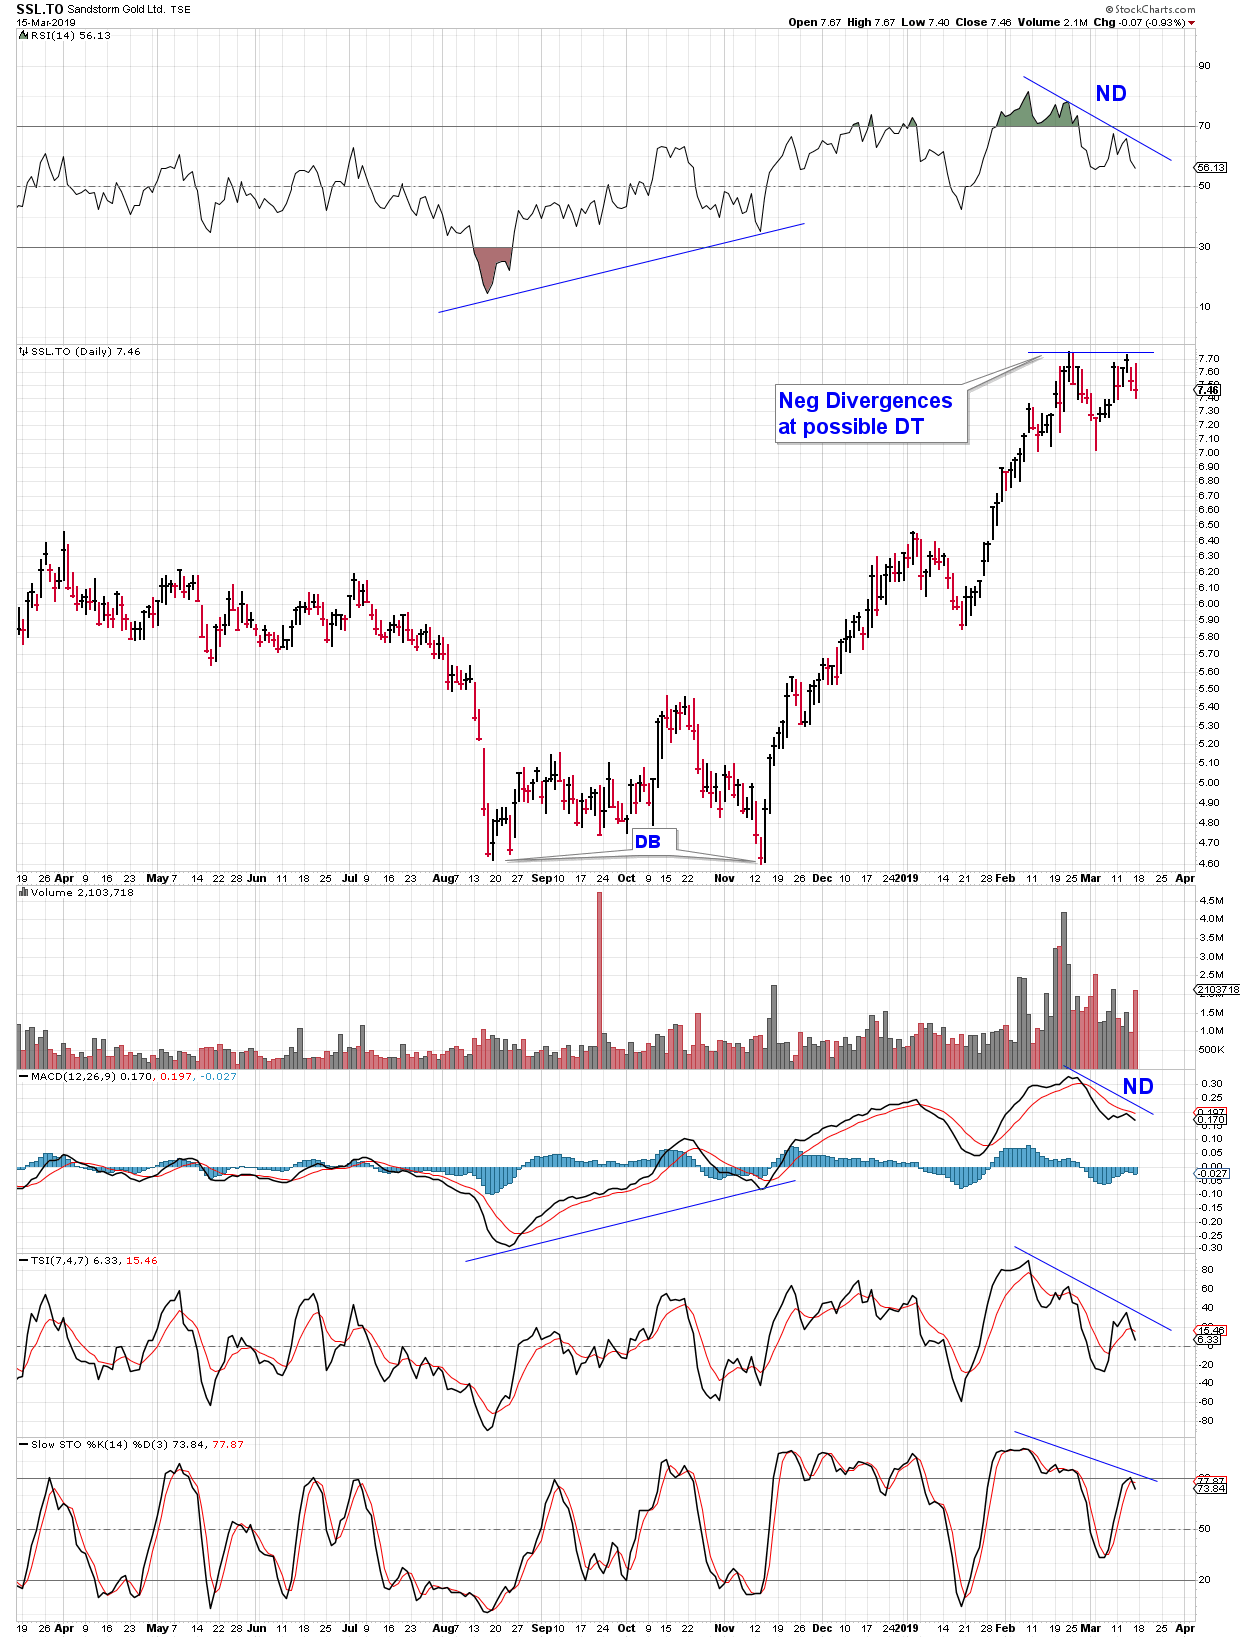
Sandstorm Gold SSL.TO Daily
What? Even a gold streamer? Seems so.
XGD.TO (an ETF) Daily
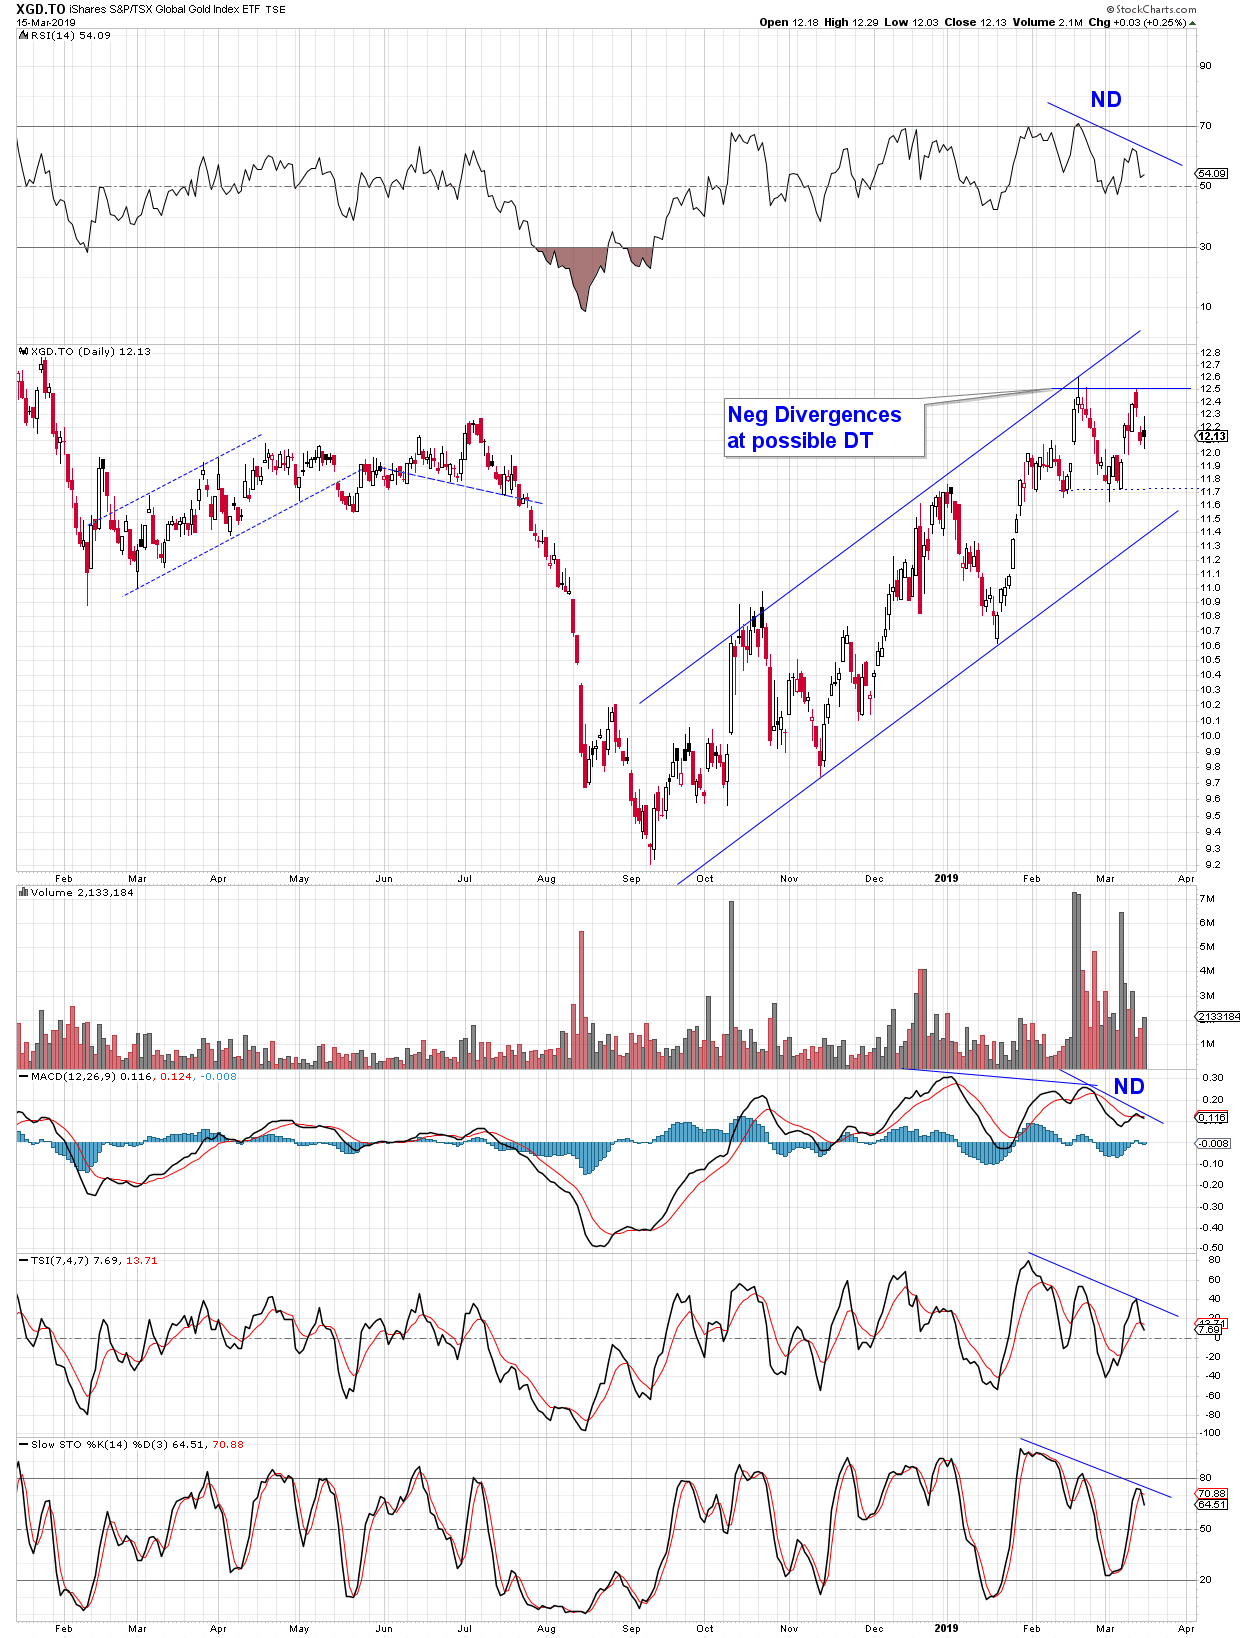
There are just some examples of leaders that are likely heading down. There is still a slight possibility the potential DT(s) are actually bull flags in the making, but IMO that is unlikely.
Cheers all, and good trading.
EDIT. I have one more chart to post that might indicate a bearish outcome. I saved a Rambus post from early 2017. Its a weekly HUI chart where it shows that all the bear market rallies are the same height. All the blue boxes are the same, except for the one on the far right. Yes, its wider than the others, but it is the same height. Its not a definitive bearish signal, not yet, but if it tops out here, then likely it is.
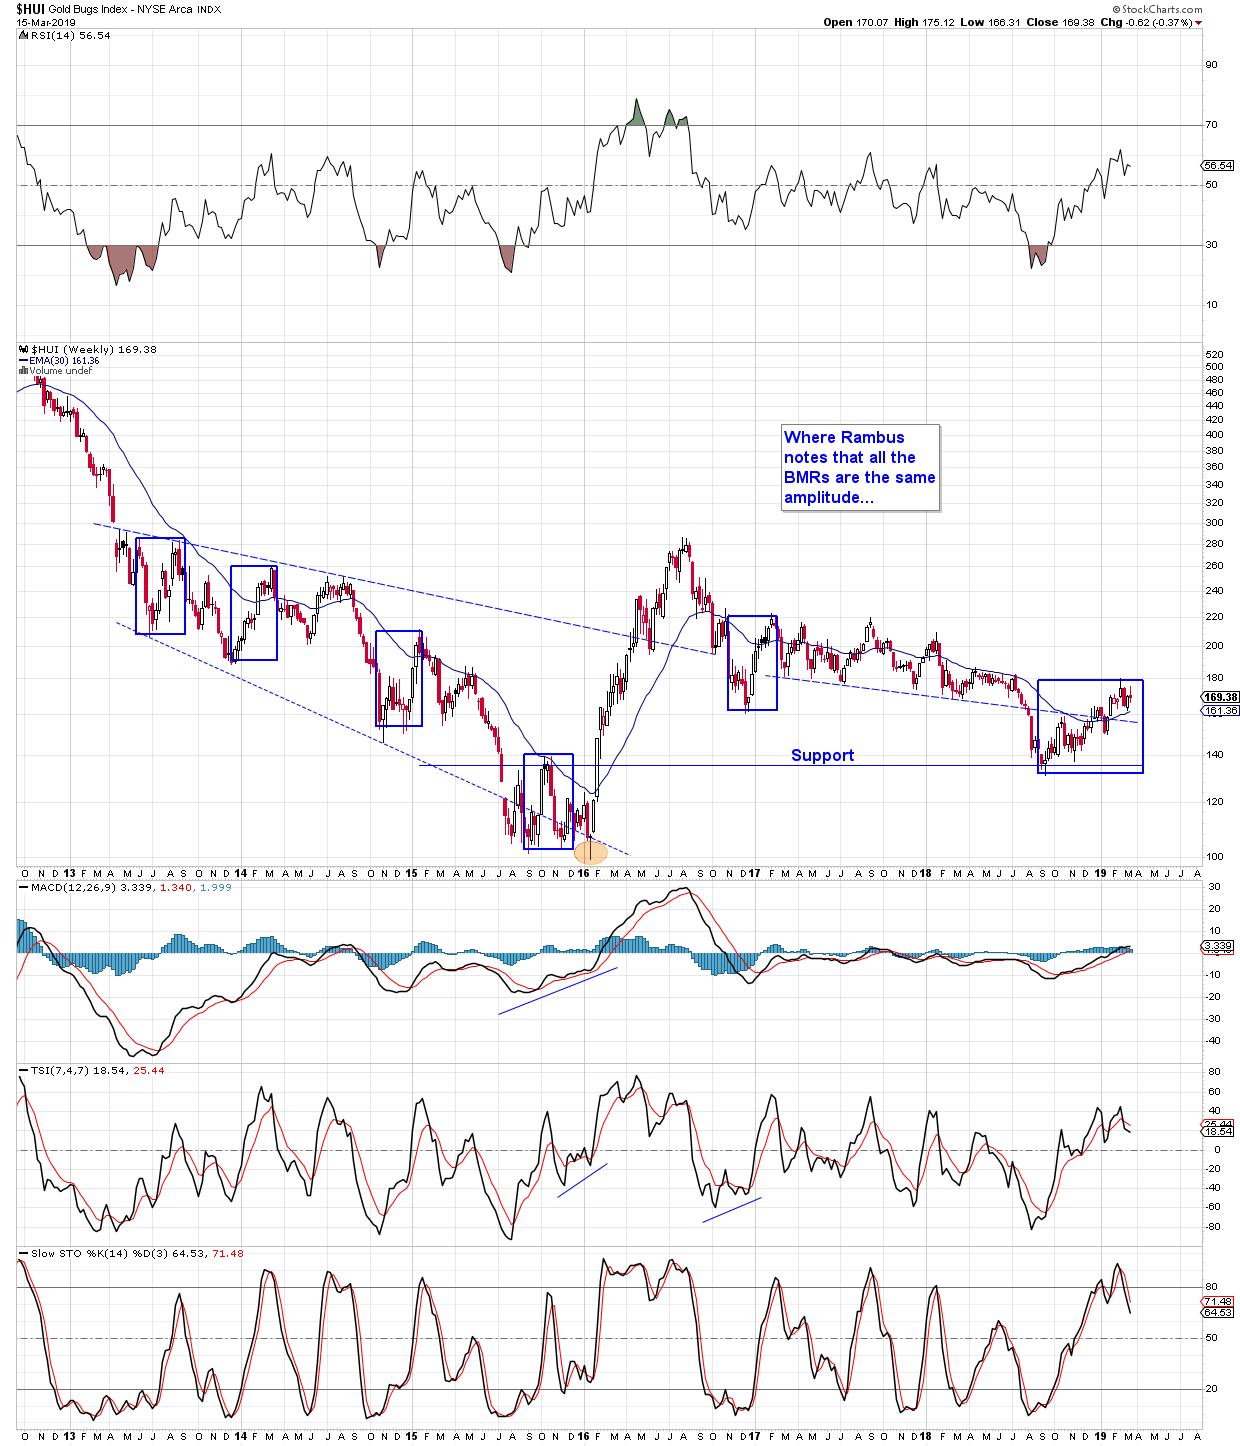
Nice chart silverfox. My, probably inane,only comment is that,aren’t you changing the parameters? I mean it’s different in the last box. I would be more convinced if the widths were all the same, too. To me, it looks like we had a breakout in Jan 2019 from the downtrend drawn from the 2016 high and maybe now that box thing won’t work now, but, what do I know? Buy stocks that are going up and if they don’t go up, don’t buy ’em. Somebody said that once before algorithms.
You are right, MM. The parameters of the box are changed and maybe it won’t work now.
RE: BMRs are the same height…what about the 2016 rally?
Dec 2015/Jan 2016 was the baby bull move. Did it mark the ultimate bottom? Most think so, and they are probably right. Still, there is a good chance the miners will correct from here. If they drop 38%, or 50%, or 62%, would you willingly ride that down? My point is be cautious, that’s all.
Very good and compelling research Silver Fox.
I don’t like the looks of the potential DTs in these leaders.
They HAVE quietly had very strong moves.
Caution !
Agree, Fox. I think this weakness will manifest from March 20th to April 8,9th. Nice work as always.
I also noticed that in the box of late 2015 that the top was made in the middle of the width of the box and corrected back to the bottom of the box and ended, basically, at the end of the width. From thence the major 2016 rally started. That was different from the other boxes. But, I don’t know what that means.