The J-Move in gold and copper:oil
I must admit I am still a little fascinated by the bullish “J-move” in gold in late 2015 and early 2016.
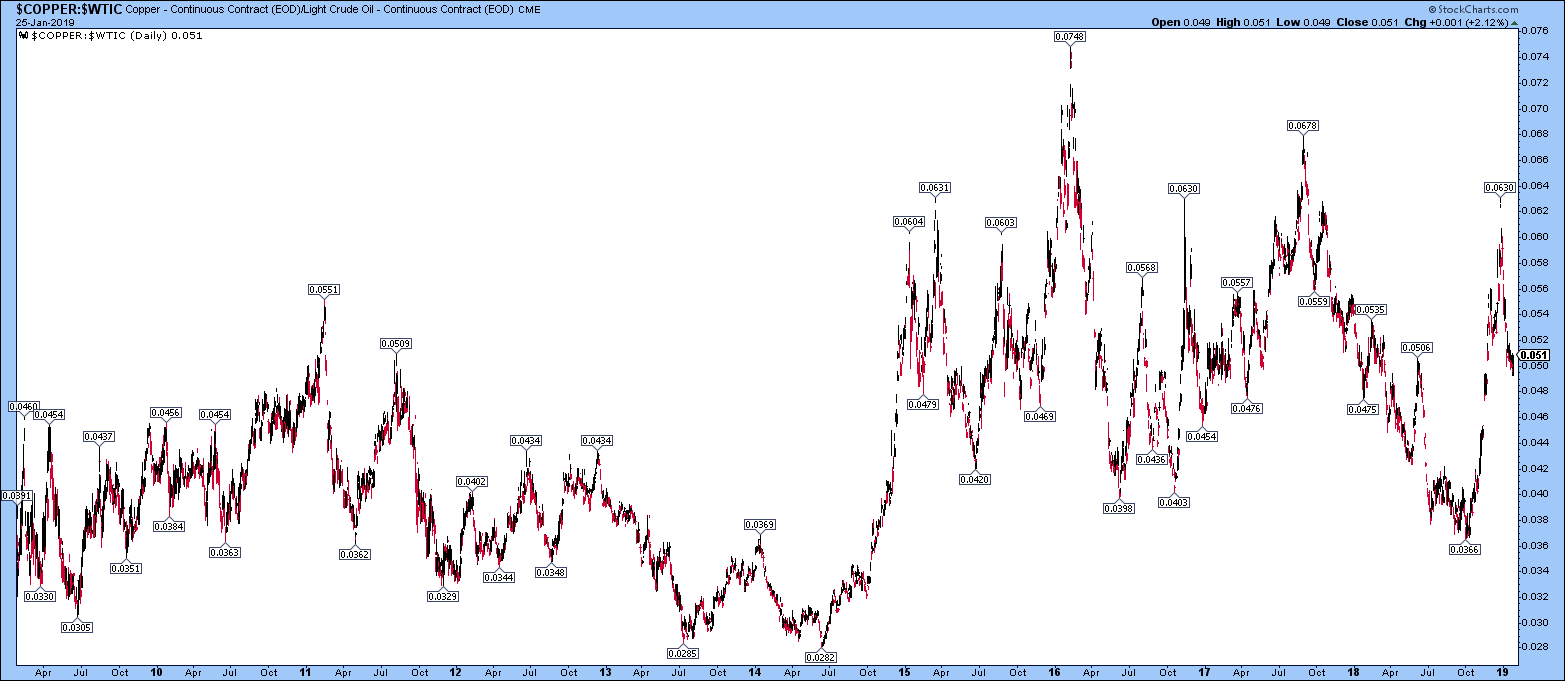
I just listened to an interview on Kitco with Gianni Kovacevic, Executive Chairman, CopperBank, who is of course bullish on copper.
He mentioned the breakout in the copper:oil ratio over the past few years, which he has watched closely, so I went to have a look at it and compare it to the gold chart.
Interestingly, this move started in 2014 after oil peaked (presumably).
The very first moment I saw the chart, I saw the same “J-move” at the start of this claimed “bull run” in copper versus oil. Now, the analyst concerned was making the case that copper has broken out against oil because of the start of the trend in electrification (mostly in terms of transport I am guessing) …
Copper J
Gold J
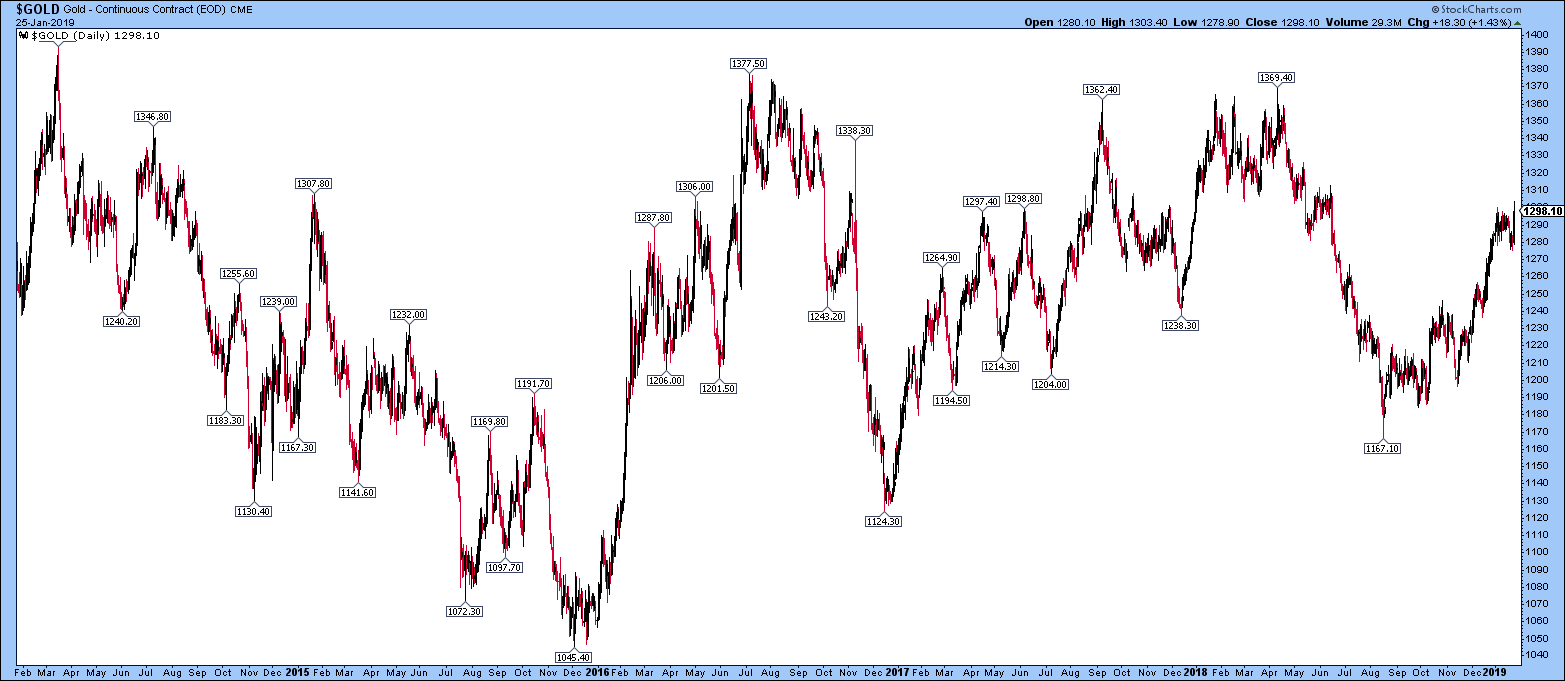
Not at the same time as the move in gold (Cu:oil was a year before gold) but very similar!
These moves stand out as unusual on both charts even if you go back 20+ years.
I wonder what if anything is the market significance of this formation?
The interview was here: