If you are looking for clarity in the PM market
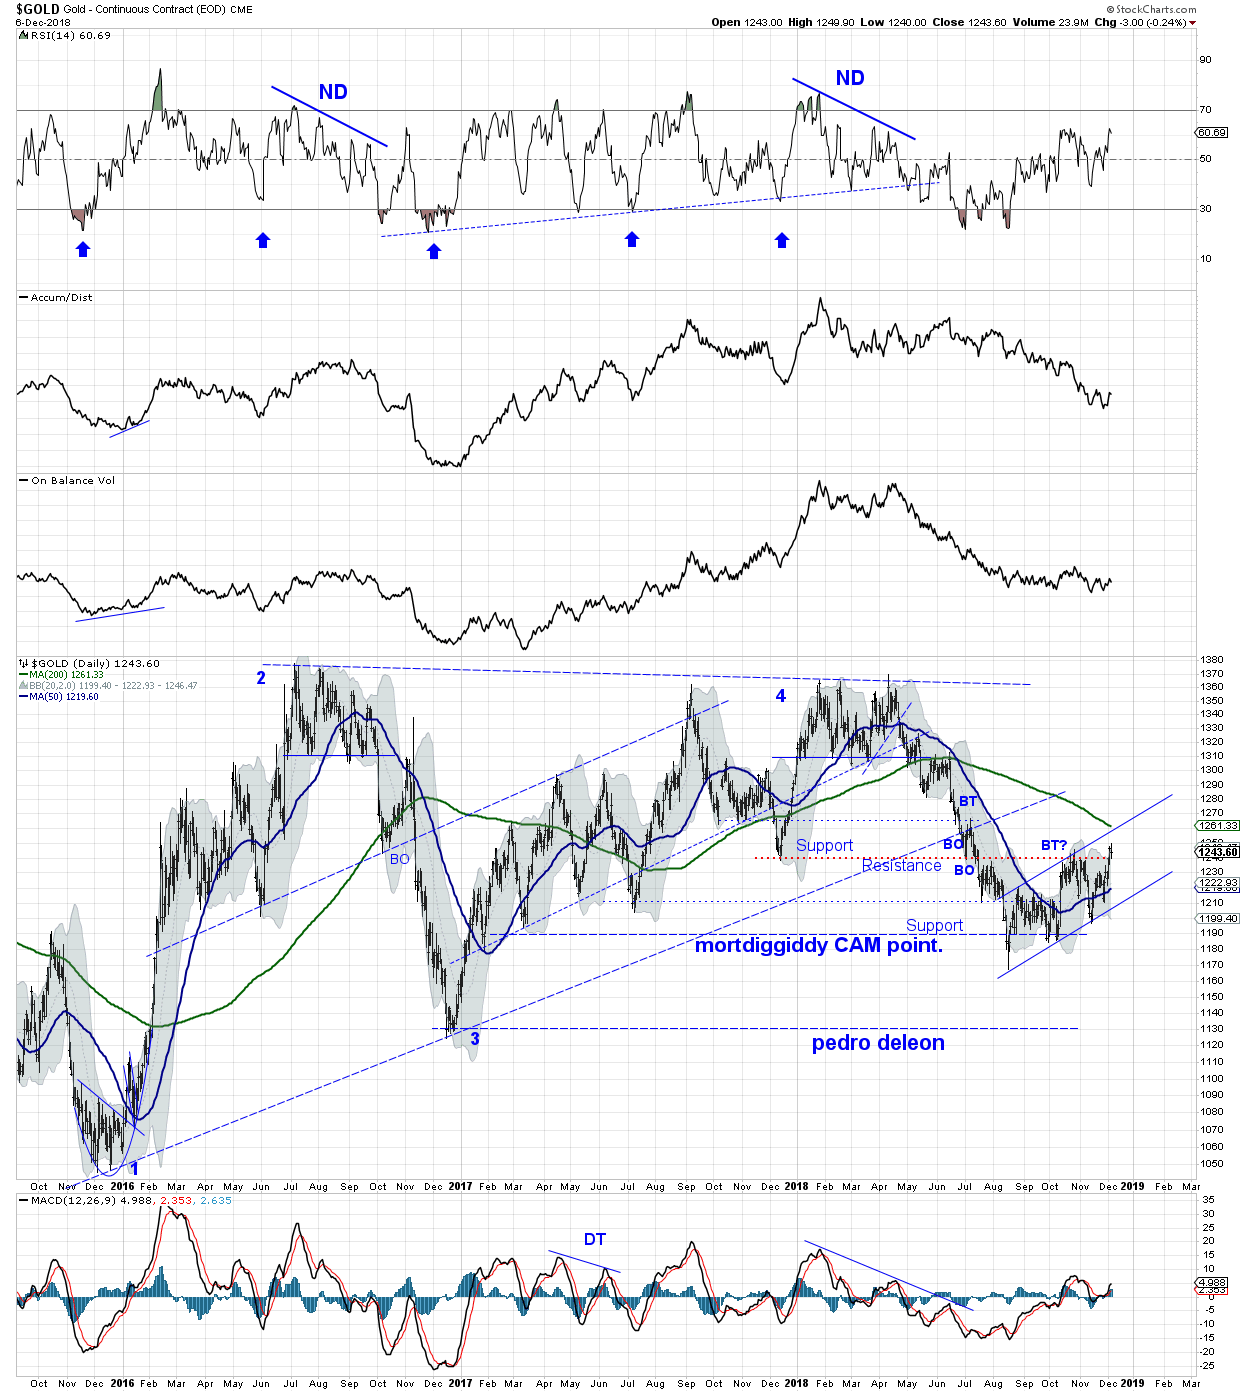
you won’t likely find it here. This gold bug is searching for evidence of a PM bottom but the market, it seems, is sending mixed signals. First chart is $GOLD – constructed long before the recent bottom last August. On it were placed the mortdiggddy CAM point and the pedro_deleon projections. There is a rally building off the CAM point (so far) but the miners remain weak. That doesn’t mean they can’t, or won’t, rocket higher. The line in the gold-dust, I think, should be the top of the rising channel where the 200 DMA should offer resistance. Break that with conviction and we got to get on our horse (or ass, if you prefer) and ride.
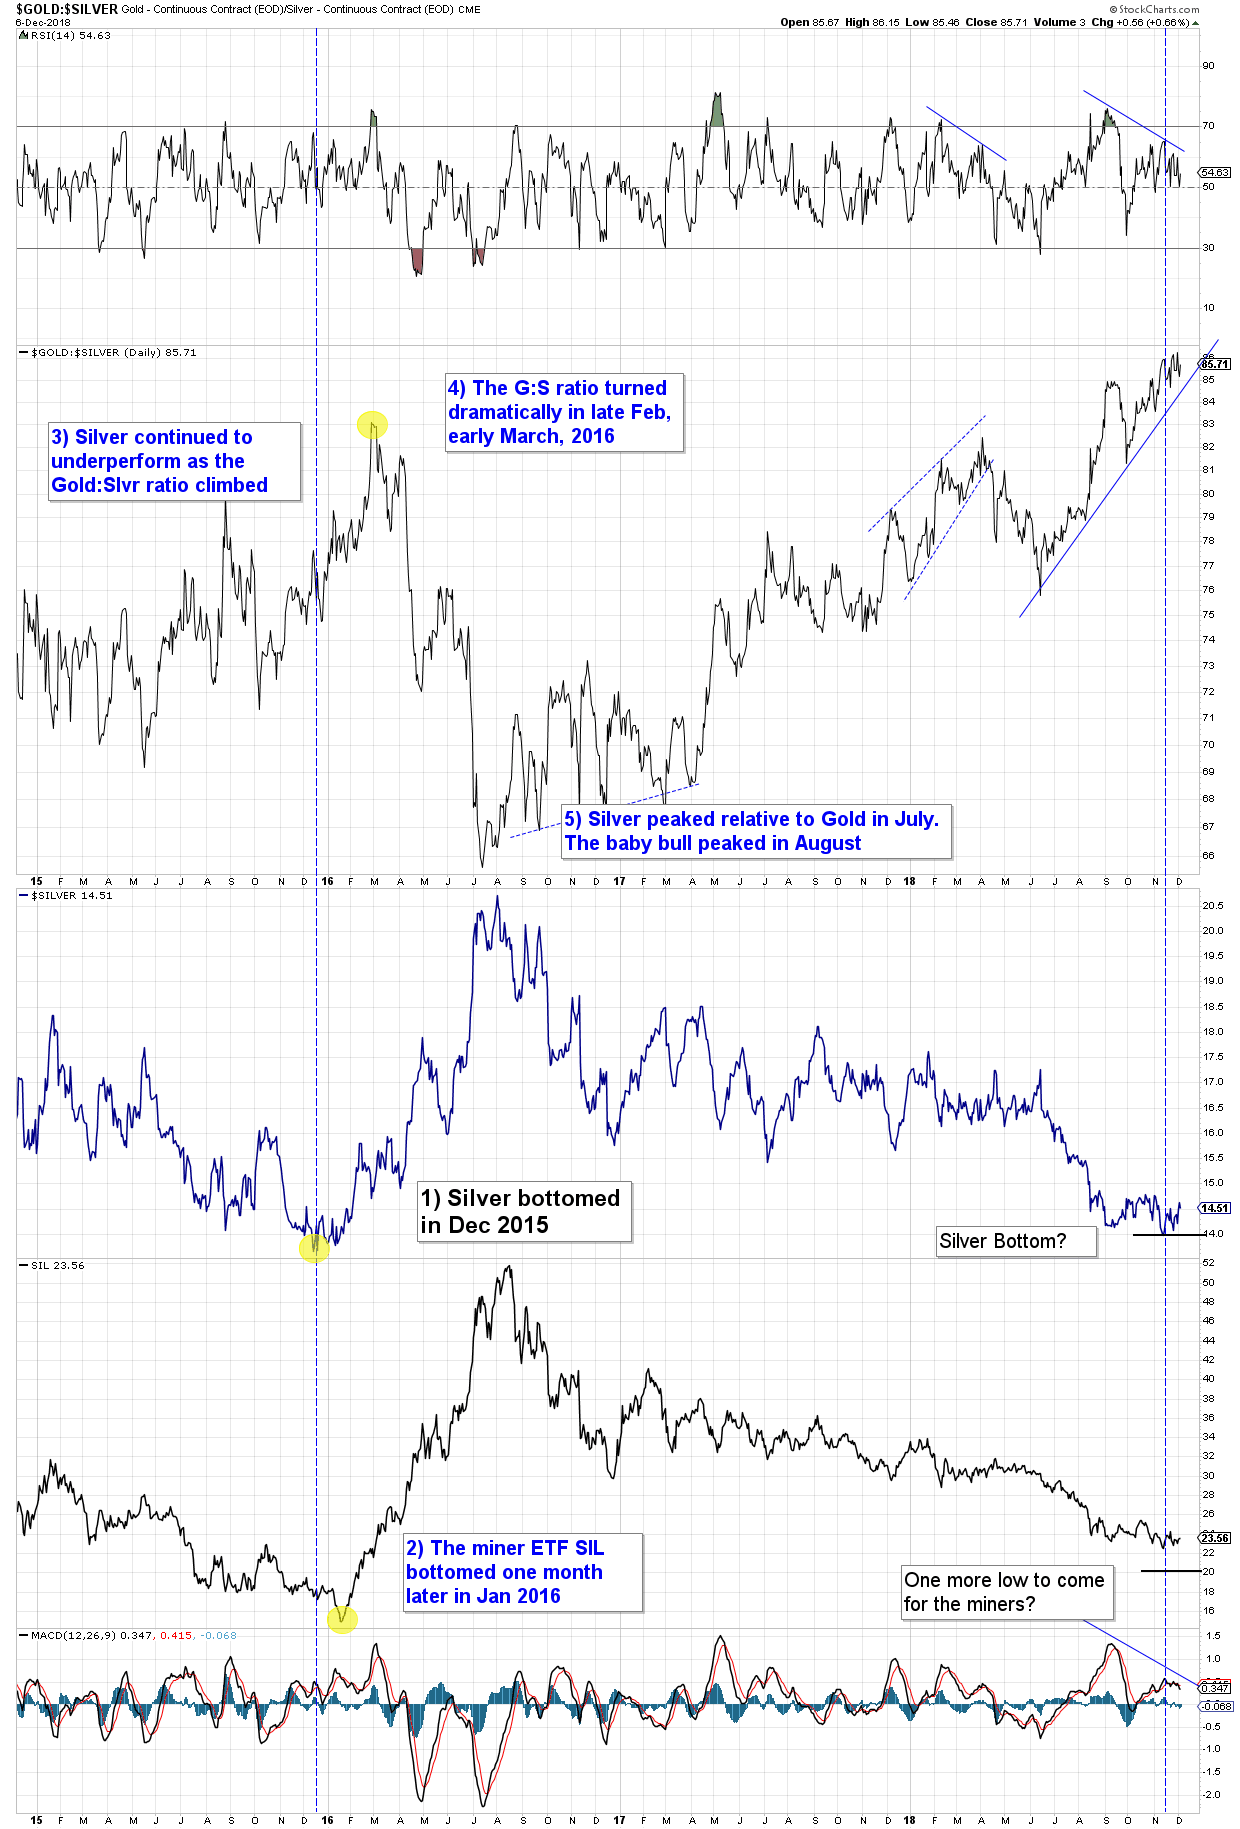
Next chart is a combo chart for $Silver, the Gold/Silver ratio, and SIL (the ETF for senior silver miners) The chart encompasses and focuses on the 2016 baby bull move so that we can compare it to present day market action. Is it possible that Silver has already found a bottom in Nov 2018, and that SIL and the Gold/Silver ratio are lagging? It is possible, yet we remain alert to the possibility there is more pain ahead for the unwary.
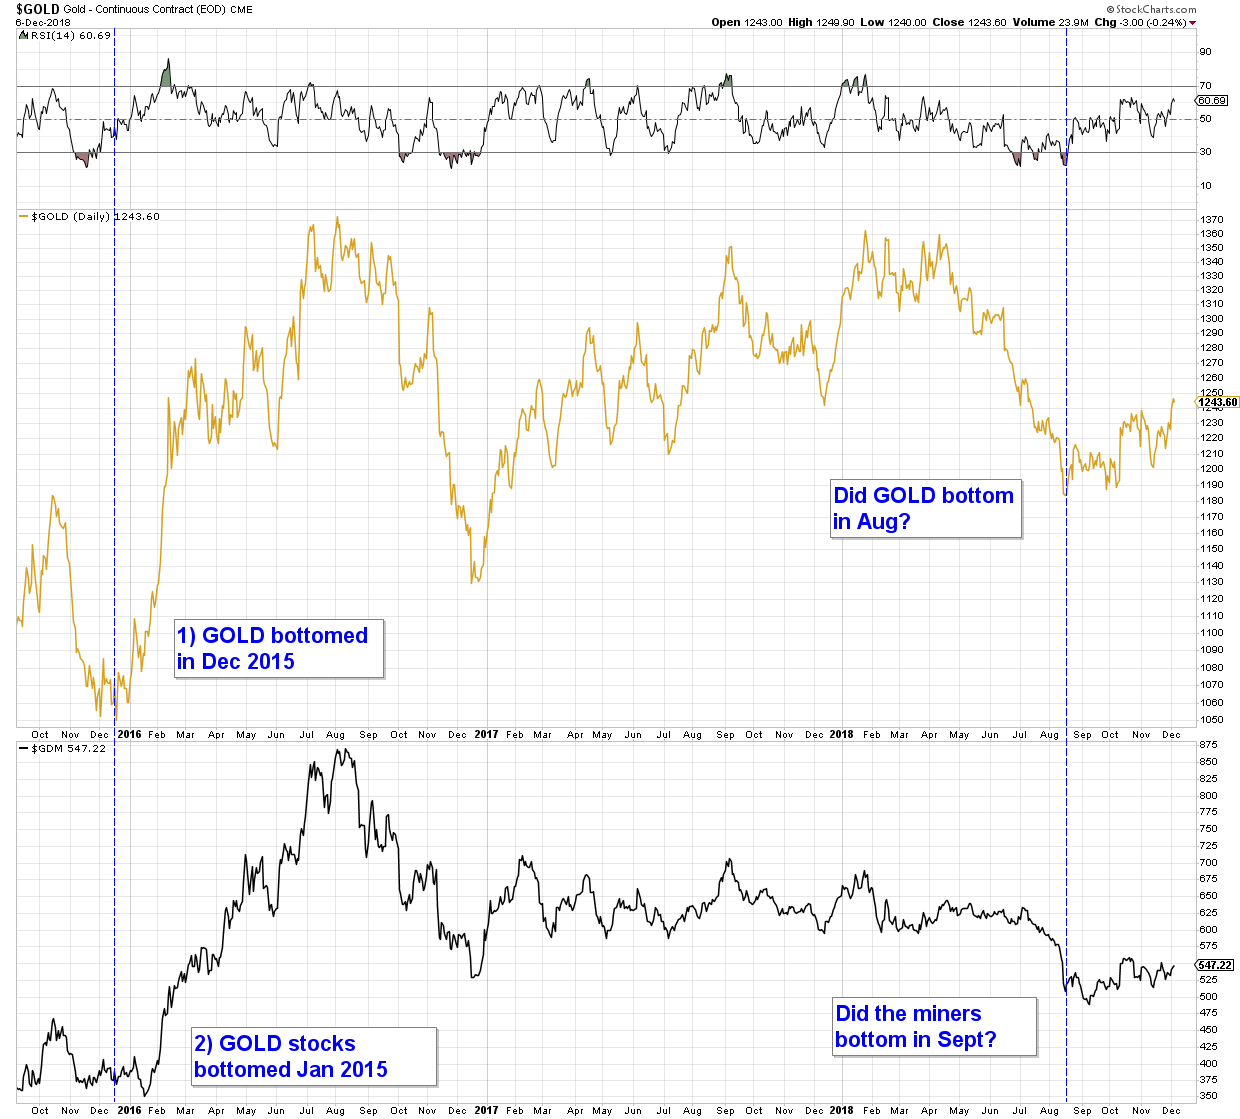
Next chart is a combo chart for $Gold and GDM. The chart encompasses and focuses on the 2016 miner surge off the bottom so that we can compare it to present day market action. Is it possible that Gold found a bottom in August and the miners did so in September? What is missing is a surge off the bottom. Don’t we have the right to expect one?
This gold bug’s take is that we likely have more work to do before Gold shines. Possibly even a lot more work. Its December, and the Gold market likes to get up to shenanigans in December IMHO, teasing with false promise. Even so, the market is a trickster and it may be up to something.
Torn. So now what?
Good work and good questions.
I vote Yes to this bottoming action
There has to be a rally in January …..its the goldbug way
Thanks Fox
Thanks SF. It’s certainly keeping us all guessing, but so far, looks good to me.