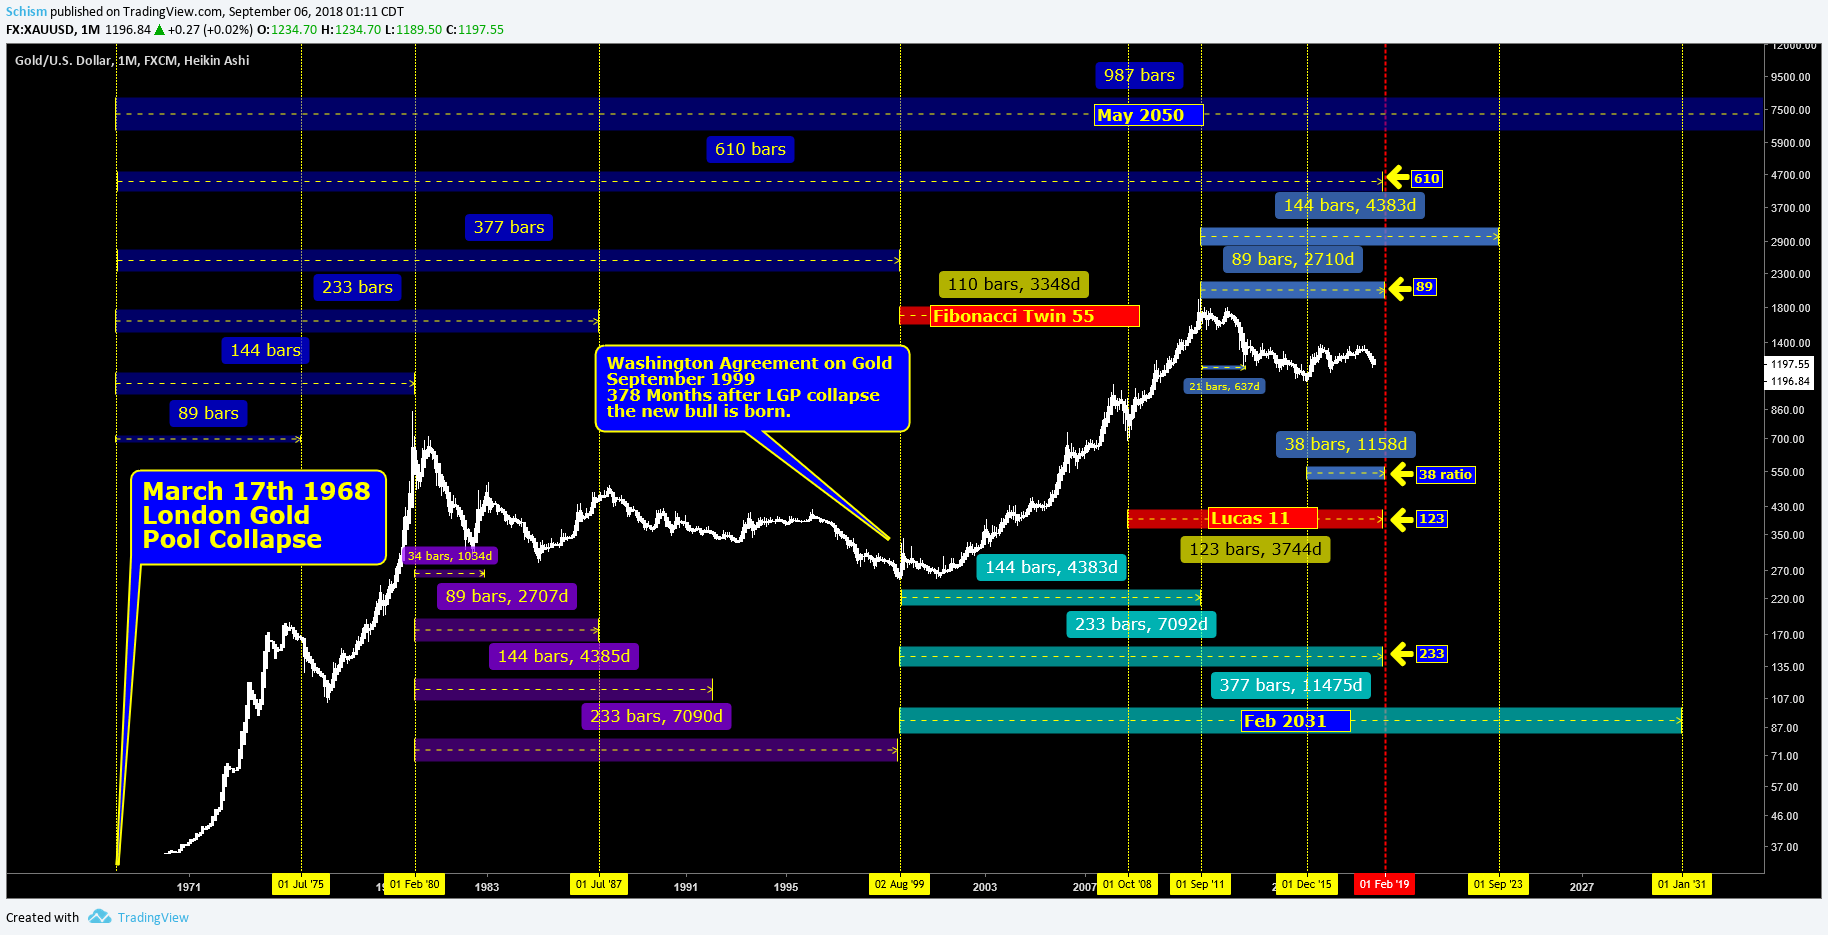
February?
Have shown this chart before and mentioned how I thought it was a possible culmination point in Gold. If the time is indeed “live” then Gold could get hammered into Feb. I thought the dollar chart jived well with the gold chart as well…showing how February has been a termination month in previous peaks. With that said this is a monthly so it might be difficult in real time for this to useful to folks. I also have big time dominoes in June and November of 2020 so maybe it last into then…I’m hoping the election is the wave 2(if this proves to be 5th wave now) low but that is getting way to far ahead in the dream sequence. Some fun Fibonacci/numerology in that possible termination date also…doesn’t mean shit but I like nerding out to that stuff from time to time.
YEAR 20+19=2019=21
MONTH/YEAR 2/19=21
MONTH/DAY 2/19=21
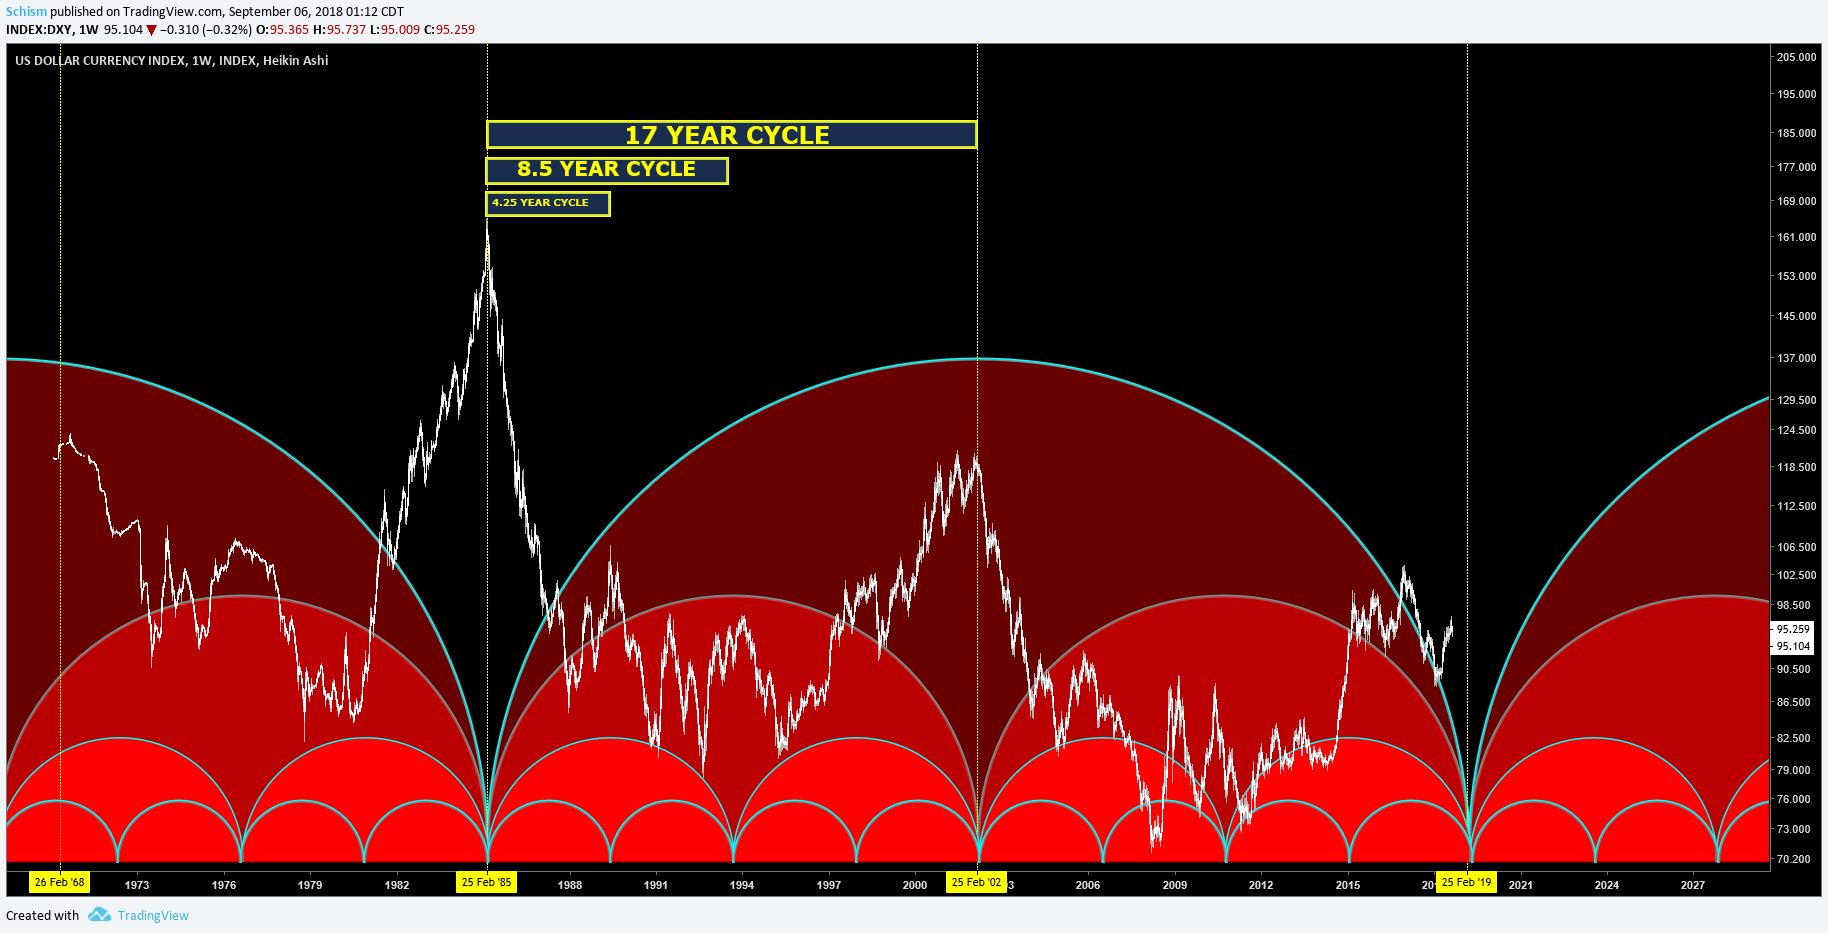
That 17 Year Cycle Chart is Something… Schiz
Very unconventional as these are cycle Tops .
Looking closely they have really been working out ….even the minor sub cycles.
Watching Feb 2019
Great stuff
Revenge of the Nerd
🙂
Ya, they’re not to bad. If it didn’t match my Gold zone I probably wouldn’t have posted it as I hate when folks connect 2 points in time and call it a cycle…2 points in time don’t prove shit. But this cycle also hits within two weeks of the London gold pool in march of 1968. These types of cycle charts can mislead people into a false hope..that’s why I do the fib stuff to try and get specific.