Significant Turning Point – Gathering The Evidence
Gold has broken it’s bull market uptrend…
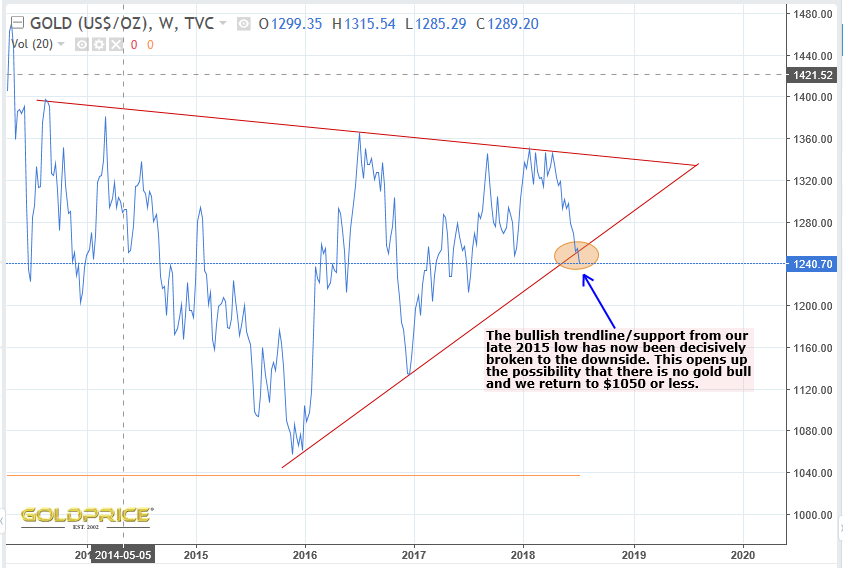
The chartology is terrible. However you cut it, the failure of a long term support line is not a good sign. BUT, after looking at it more closely, is it as bad as it appears ? Indicators can help, and understanding the cyclical nature of markets also helps. We’ve seen false breakdowns many times, and you have to have them to destroy sentiment and exhaust selling. That’s what sets up the most powerful rallies. Let’s see if we’re likely to be getting to that stage by studying the WM%R indicator…

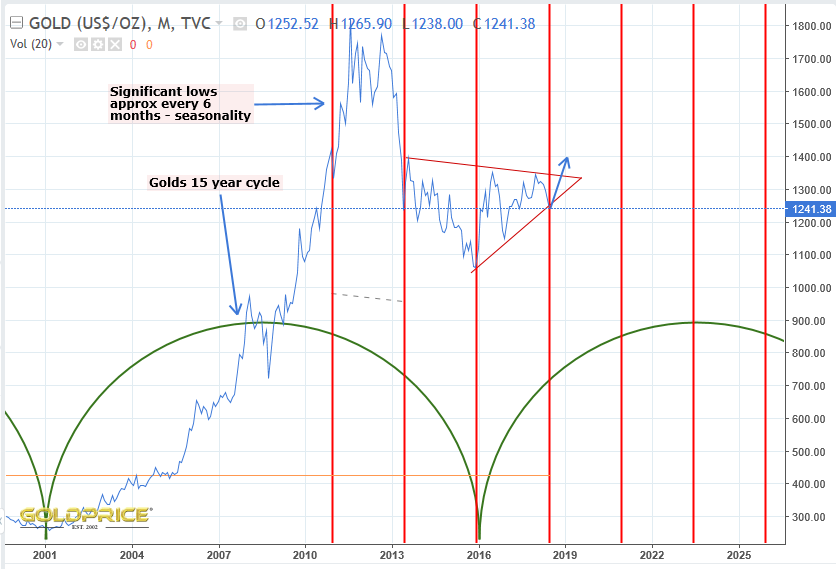
So we’re just about as oversold as it’s possible to get. Interesting. How about the cyclical nature of the gold market ?
The dollar’s inverse correlation to gold price is often pretty strong. Let’s see if the indicators can give us a clue there…
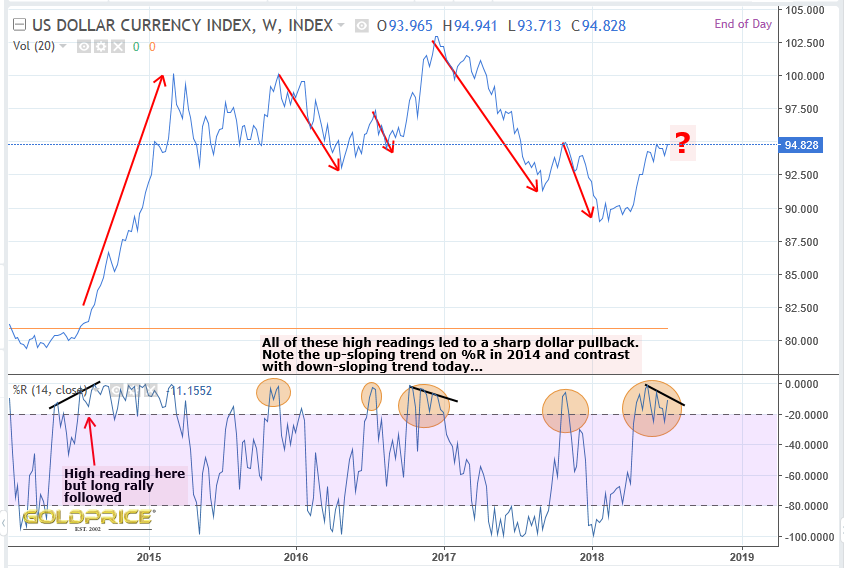
So the dollar is overbought. Another clue maybe ? I know it can remain overbought for a long time and result in a huge rally like it did in 2014. The down-trending peaks in the WM%R might be hinting at an imminent turn though. Each peak is lower than the last. The dollar has it’s own, very reliable cycle of course. Perhaps if we know where we are there, that could give us some more clues as to which way this will ultimately resolve…
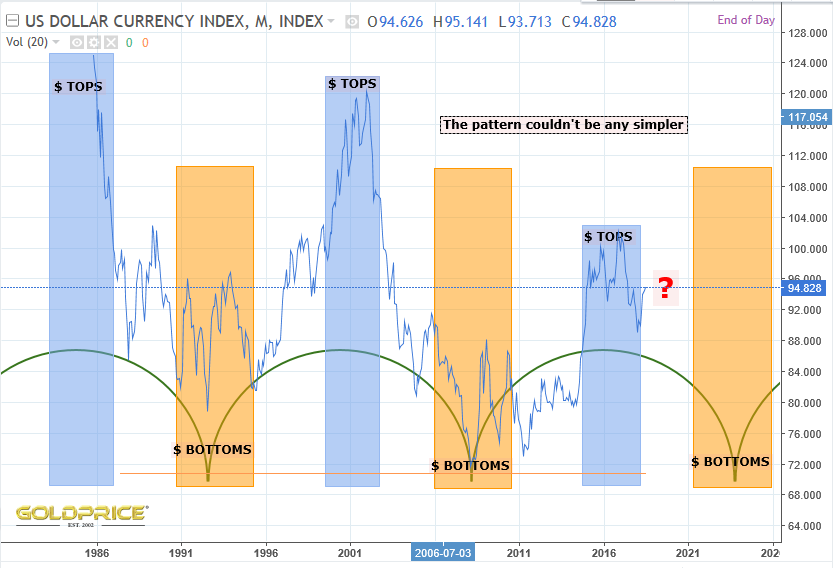
So the timeframe for the dollar top is behind us, and the cyclical dollar low is ahead of us, pulling price down like a magnet over the coming months/years. I rest my case for golds defence.
Norvast not worried unlessed dipped below 1237. Always amazing how these guys generate these numbers that end up as bounce points. Hope it holds, but either way, 1237 was brought up by him almost a month ago and here we are. That is why I follow the Tent and the Forum
CHF bounced so what does that mean?
The 19 Jul will be a re-test for the USD and gold
I do not know whether gold will drop below 1236 but we can expect a re-test.
Take a look at the CHF chart.
The Williams %R (21,-100) reached -98 on the 12 July so we can expect a bounce then a re-test in around 7 calendar days time.
I expect gold to do the same.
Great Analysis Northstar.
Thanks
Yeah I got 1238. I think it hit it on the nose. It depends. My pitchfork for some reason allows around $1232 and a simpler trendline bottom on the daily chart allows around 1238. Either way, it’s struggling to hold it.
$1238 also matches the low earlier this year.
I like to look at the 4year daily chart at the mo’ and my Andrew’s pitchfork pivoted on 1130, 1307 and 1045.
http://1000gold.blogspot.com/2018/07/line-in-sand-for-gold-around-1230.html
With median lines, it is sometimes easy to move them around a bit. The $1124 low at end 2016 just missed the lower trend channel line. However, if you line it up, I would say we hit the 1045,1124,(1238) lower trendline on the nose – or did it? NO you are right, even with daily candlestick chart it broke below. As for daily closes, I’m not sure. I’m posting them on the link above.
Any move below this pitchfork would invite a back-test which could even be a little above $1238 since it is up-sloping and then a channel doubling at least of the lower half of the pitchfork from the median line to the bottom. That would be a $165 drop. Median line is at 1395, lower channel at 1230) or double that $330 is you are a real pessimist. Price targets would then be around 1230-165=$1065 or 1230-330=$900 for an immediate drop or a little higher for a more gradual drop, since the target line would be up-sloping with time.
Off topic. Looking at Kitco in the last couple of days I noticed that platinum is well below palladium:
Platinum 823.00 -16.00
Palladium 937.00 -7.00 as of now.
There were many pundits, even famous ones who were bullish platinum as far back as 2013 and continued to be since – and now it is under $825! They were way wrong.
My health is not too good right now, so I have time to post but am likely to be a bit sloppy!
Re gold/GLD, I have a LT bottom forming around (US) Labor Day. (My LT = months up to a year)
They know where these lines in the sand are.
They will flush it, grab what the late sellers offer, then turn it around.
Watch the dollar.
VLT, I’m still bearish on EVERYTHING.
But for now, the same old same old game goes on.
Dave, its funny you mention platinum. I got an email from sprott today telling me how great of a buy it is. A little thing like a downtrend doesnt bother sprott.
I think might have been his good mate initials RR who I remember talking bullishly on platinum years ago. I can’t place when exactly but I also heard several others bulling it up as it continued down for years afterwards!. OI think it was either at $1300 on on its way to 1300, may have been 2013 or 2014 or thereabouts. Now it has recently broke $811 support from 2016 by going down to $800 and is just above it again at $830. As a 5 year investment it would have been crap. I mean, now we are 5 years further through the bear market and it has to end sometime (presumably)!
I must admit I was tempted by such experienced voices but never bought any, luckily! I was more templed when rhodium was near $1,000 that one day it might go back to $10,000. That seemed a much better buy to me. Of course it went under $700 later but no so long later it’s at $2100. Ol’ Ned Schmidt nailed that one when he wasn’t busy talking about agriculture!
Except for a couple of months in the financial crisis of 2008 and a few days at the start of 2016, if someone bought platinum at any time since about January 2005, they are holding it at a loss. thirteen years is a long time to wait. The peak was 10 years ago, more than 2.5x today’s price. Now that’s a bear market! 😉
http://stockcharts.com/h-sc/ui?s=$plat&p=M&yr=18&mn=0&dy=0&id=p84715185119&a=422997387&listNum=1
More like SPLAT than $PLAT!
Exactly. Love the idea buying low, but it can turn into dead money.
I agree Pedro. I think or hoping for be a violent counter rally beating shorts into submission only to fade again. Waiting for big rally. A break below 1200 should scare the hell out of everybody.
If rates fall due to sm correction then things will get interesting, things might change cor pms