$GOLD – Daily (You don’t want to see this chart)
If $GOLD broke out topside to say, $1385, and did a successful BT, we would all have a pretty good idea the PM Bull market was underway. 1, 2, 3, 4, 5 breakout! And away we go. Right? Back up the truck.
What does this chart say?
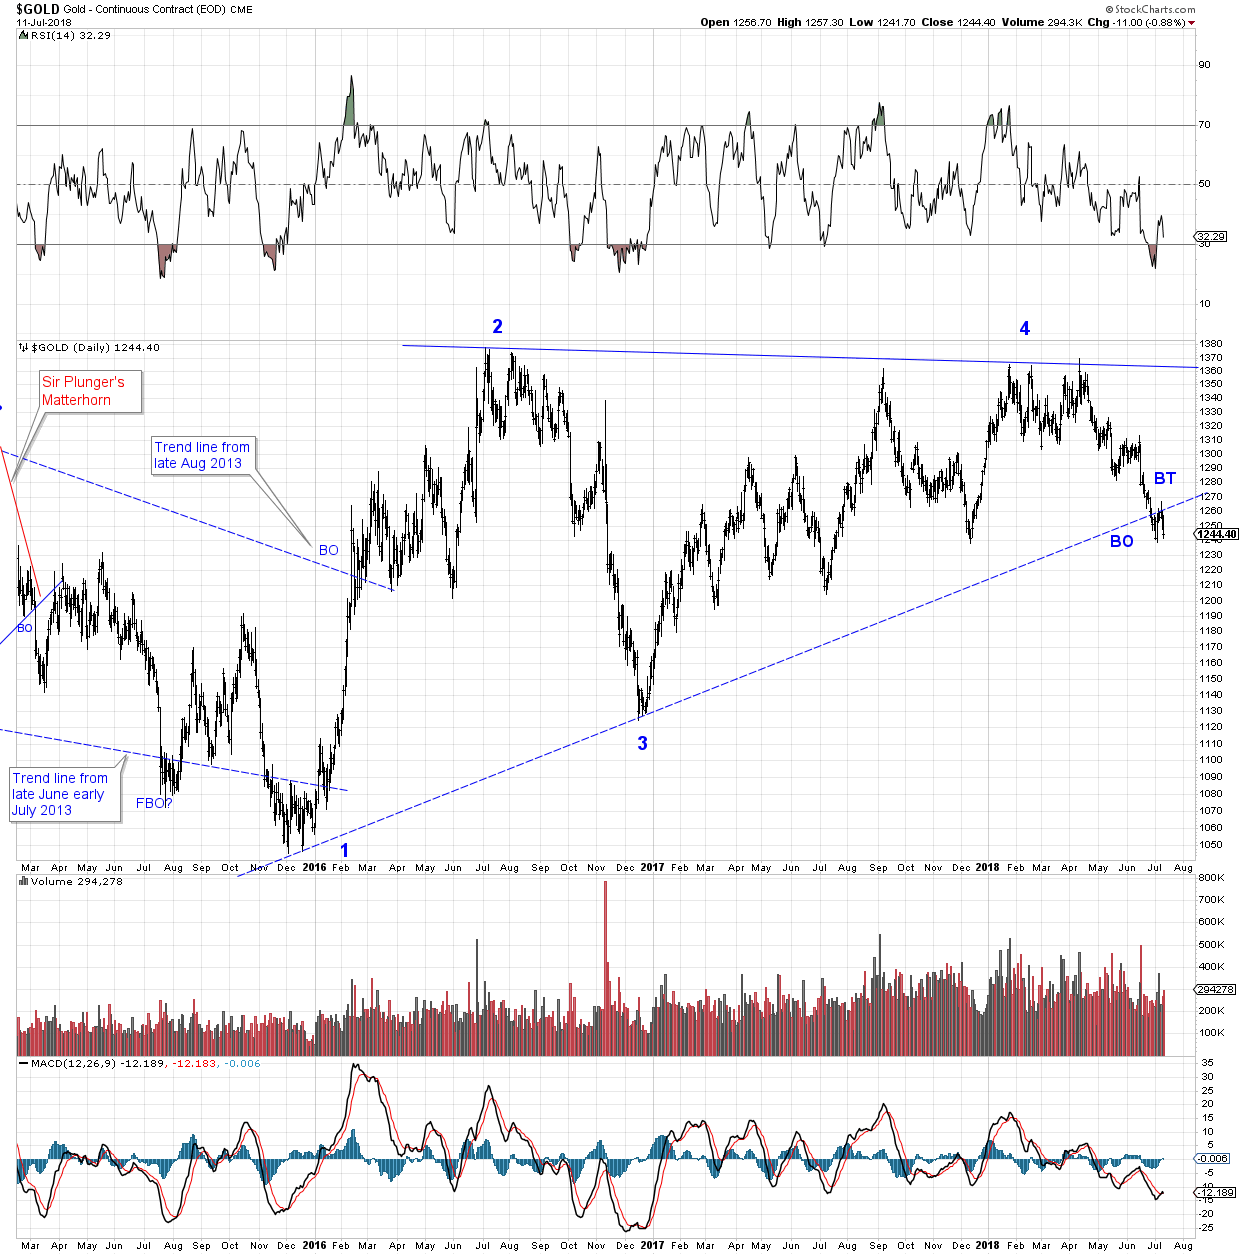
Are you getting a hollow feeling too…?
EDIT: Gold is breaking down from a 2 1/2 year long consolidation pattern at the same time that $YEN is breaking down through a 2 1/2 year long trend line. Coincidence? $YEN is simultaneously breaking downside from a SHS pattern that has a Price Objective (PO) approximately 6% lower. Hmm… If GOLD also declines 6%…
(1240 minus 6% = 1165 gold) Hope I am wrong.
gET THE hELL OUT OF THE tRUCK….iT’S GONNA bLOW !