PMs, the US Dollar and Time
This is a timely piece of research and should be given consideration since he called the high in gold last September to the very day.
As always, remember there are NO GUARANTEES in TA – only probabilities.
***************
METALS: Dollar Pressured May 08, 2018
With the U.S. Dollar this week posting its largest cumulative rally since topping in early January 2017, the predictable effect on the metals has been weakness in gold and silver prices. The dollar rally basis the index continuation chart has retraced 44.6% of the multi-month decline, or 460 points in 56 trading sessions. This has been as of today, the largest dollar rally in both magnitude and duration since the high. Obviously, gold and silver have each experienced pressure on the downside.
The question today is whether the dollar is approaching a near term rally high. implying the metals are nearing a low, or does the dollar rally have far more time to run. We find from experience that the obvious correlations work just so long, before the discounting mechanism in the market begins to take hold. With that possibility approaching, we wanted today to simply take a look at some gold and silver futures charts. Our first chart today is a weekly gold.
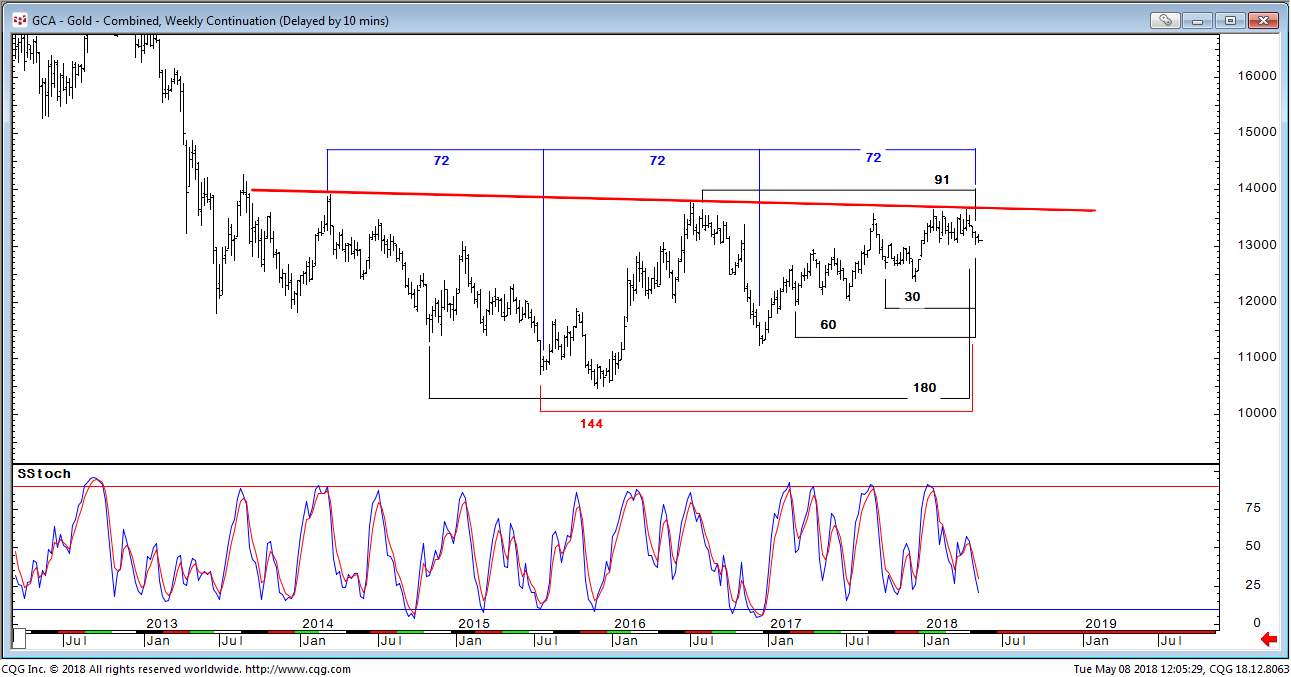
The chart above notes the tendency of price to experience turns at 30-week intervals and multiples of that period. The more intervals that are present and closely clustered, the higher will be the probability of a turn. Prices are currently moving down while in a time cluster of 30, 60, 91 (off by 1) and 180 weeks from previous turns. The observations are sufficient in number to consider the market is entering a period for a low. We have also added the 144-week Gann cycle and interestingly, the half-cycle of 72- weeks which has been accurate. The solid red line supports the idea that a major base of four years has been forming and is now maturing……..
https://goldtadise.com/wp-content/uploads/2018/05/TechFocus-Weekly-Precious-Metals-05-08-18.pdf
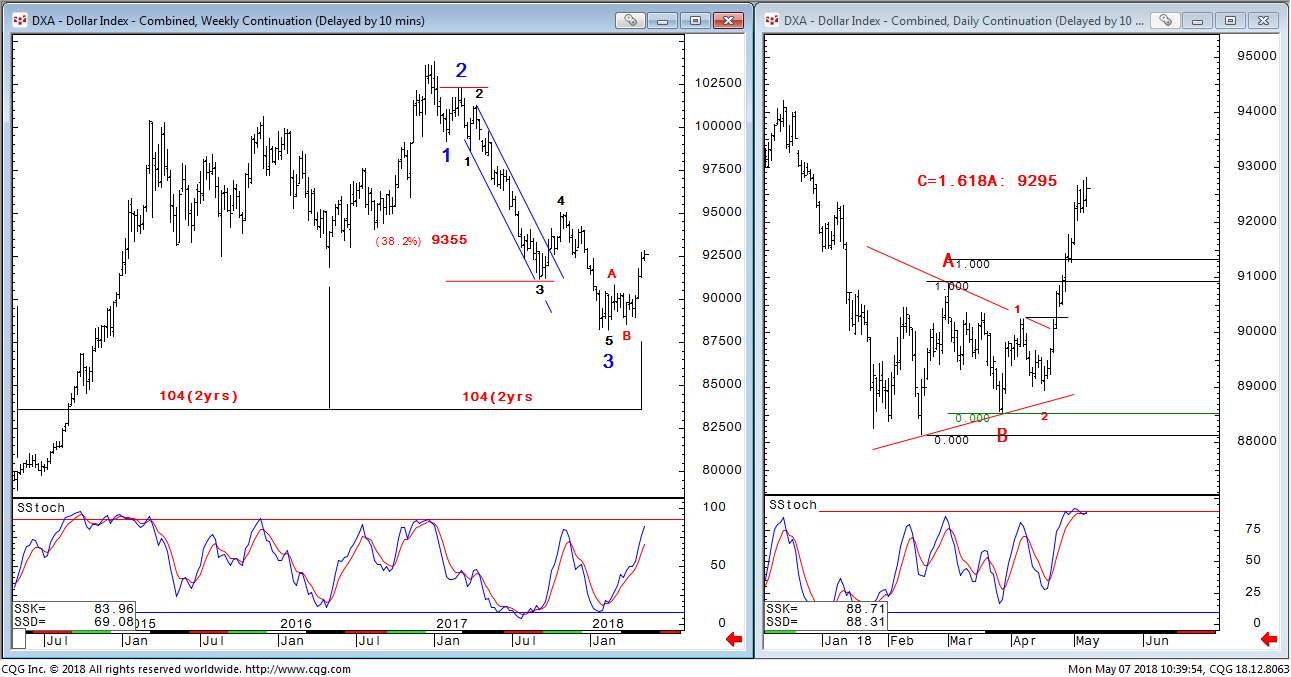
Monday, May 7, 2018 US Dollar Index – Weekly and Daily Continuation
Support reset to 9100 plus/minus. Resistance 9300-9350. The dollar high today thus far has been 92.825. (We are writing a little earlier than normal.) The Fib relationship we are looking at is 92.95 but 9300-9350 is anticipated resistance. On the weekly time measurement, a one week allowance is permissable when dealing with time, so this week could still accompany a possible high as a turn.
https://goldtadise.com/wp-content/uploads/2018/05/The-US-Dollar-Euro-and-Yen-05-07-18.pdf
Thank you BBM.
Not a popular view right now, but I agree with him. Thanks.