$USD (UUP) – Update
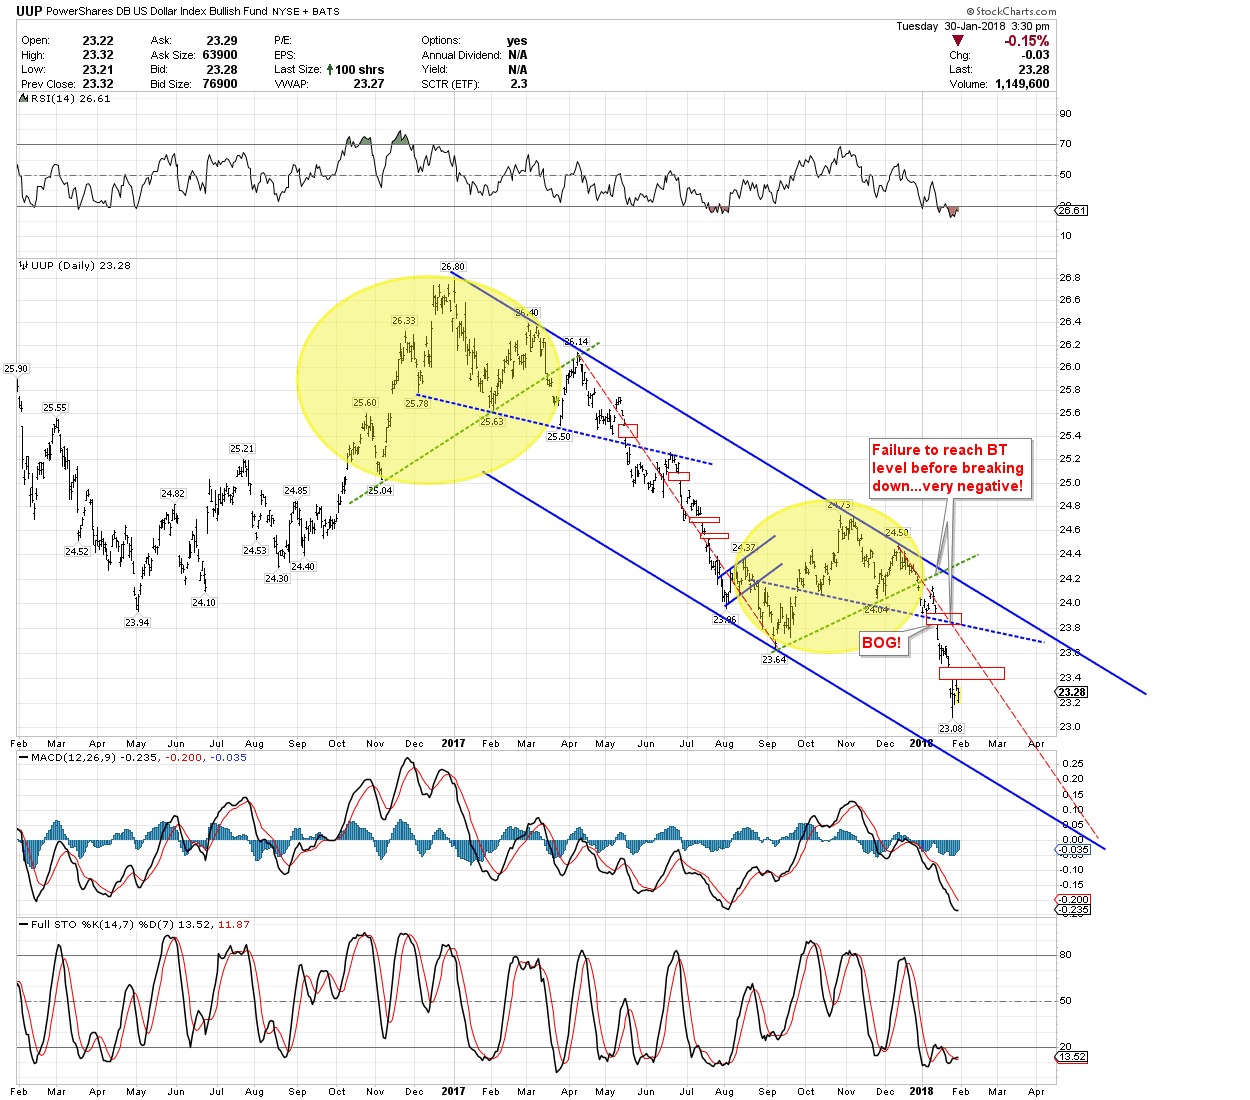
As we can see in the chart below, the USD plunge has gotten a bit ahead of itself, time-wise, as reflected in its relation to the falling red-dotted line. However, this is definitely a technically negative-looking chart! As noted, the USD has failed to muster even a decent backtest (BT) of recent breakdowns of key support.
While I expect at least sideways price action in the near term to resolve the time issue and unwind present oversold indicators – I’m not convinced at all that even the recent gap (red box) will fill before the downtrend resumes in earnest.
For example, when we look back at the move from the top to bottom rail during April-Sept, 2017, we can observe that there were many gaps along the way that did not fill…