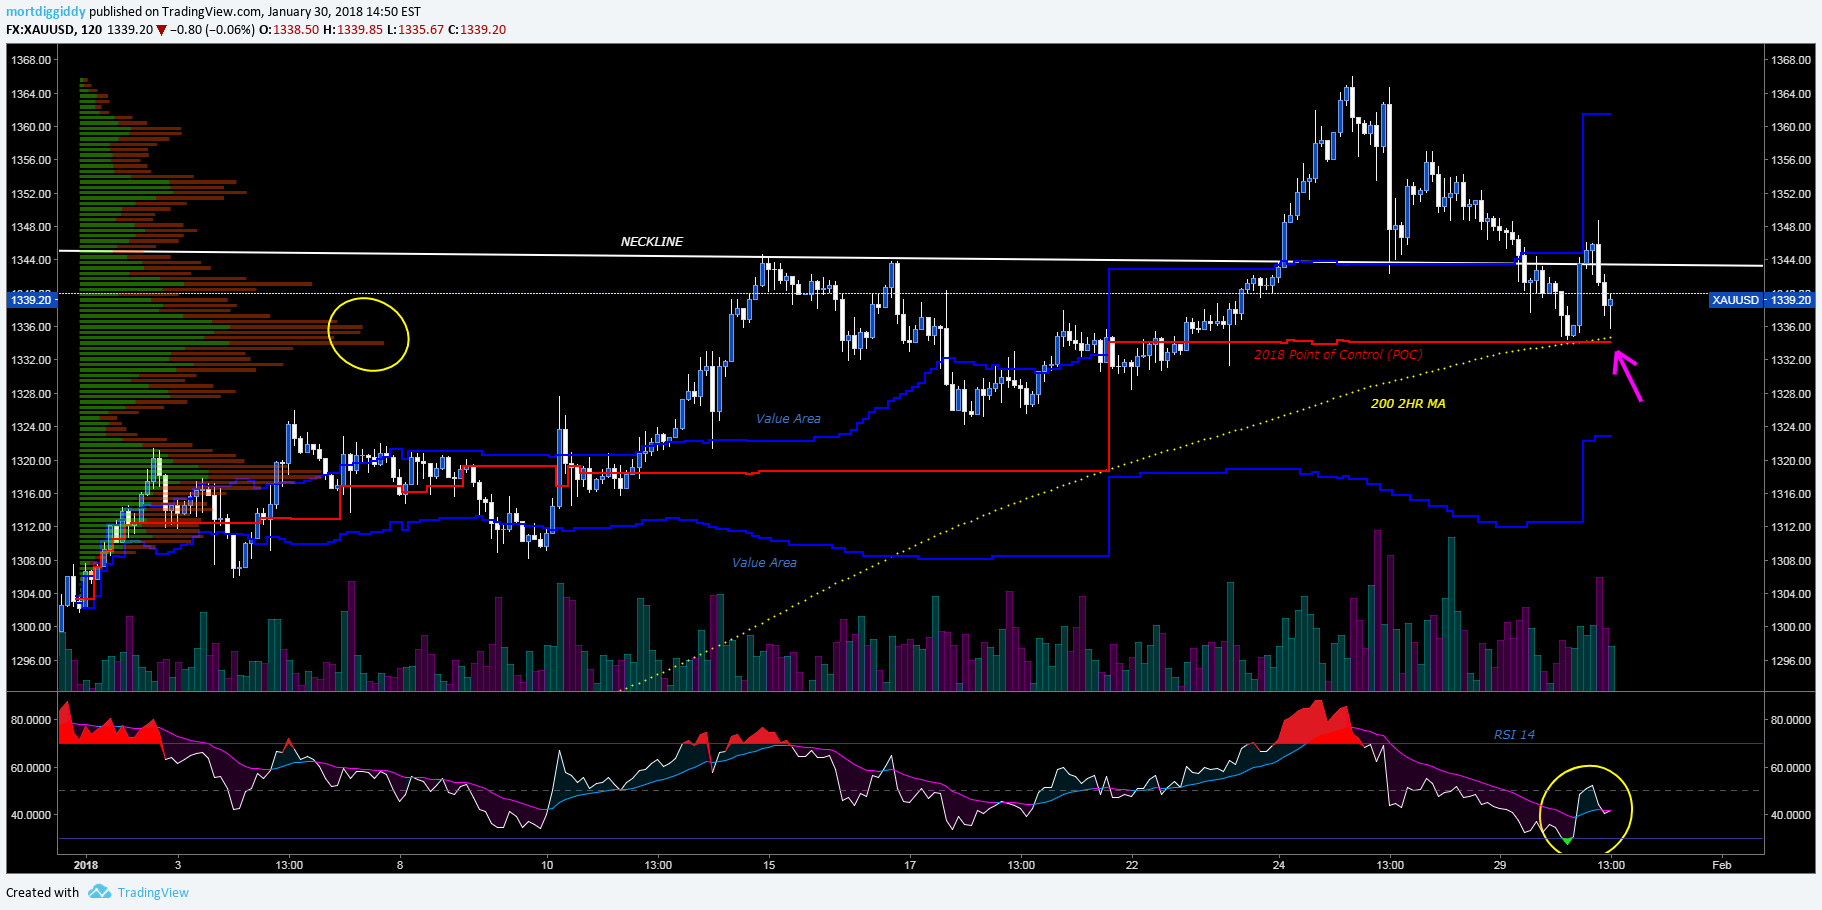
Gold Testing 2018 POC
Gold is testing the 2018 Point of Control (POC), which happens to be just below the neckline that stretches back to 2013.
This is the peak area of the volume profile for the entire year so far (highest volume peak). Usually something like this provides good support, especially when coming from so far to meet it. For example, the exact bottom today for the Dow Jones was the 2018 POC. It is similar to the VWAP (Volume Weighted Average Price) but only shows you where the highest volume peak is in the profile, circled left. The VWAP shows the average price-volume location for the entire data-set instead (the year VWAP is about 3-5 points below the year POC in this picture, not shown).
As the profile develops and we carry on from the anchor point (Jan 1st, 18:00 EST) the Point of Control changes. The red line shows the evolution of that peak volume location as it has changed over time.
The value area is simply +/-35% of the total volume on either side of this. We find the point above the POC where 35% of the volume is inside the upper window, and the point below the POC where 35% of the volume is inside the lower window, so 70% of the total volume in the observed date range (all of 2018).
I don’t use volume profiles very often but they do help you not get into a trade that is not in the “value area”… meaning you will not buy at extremes.
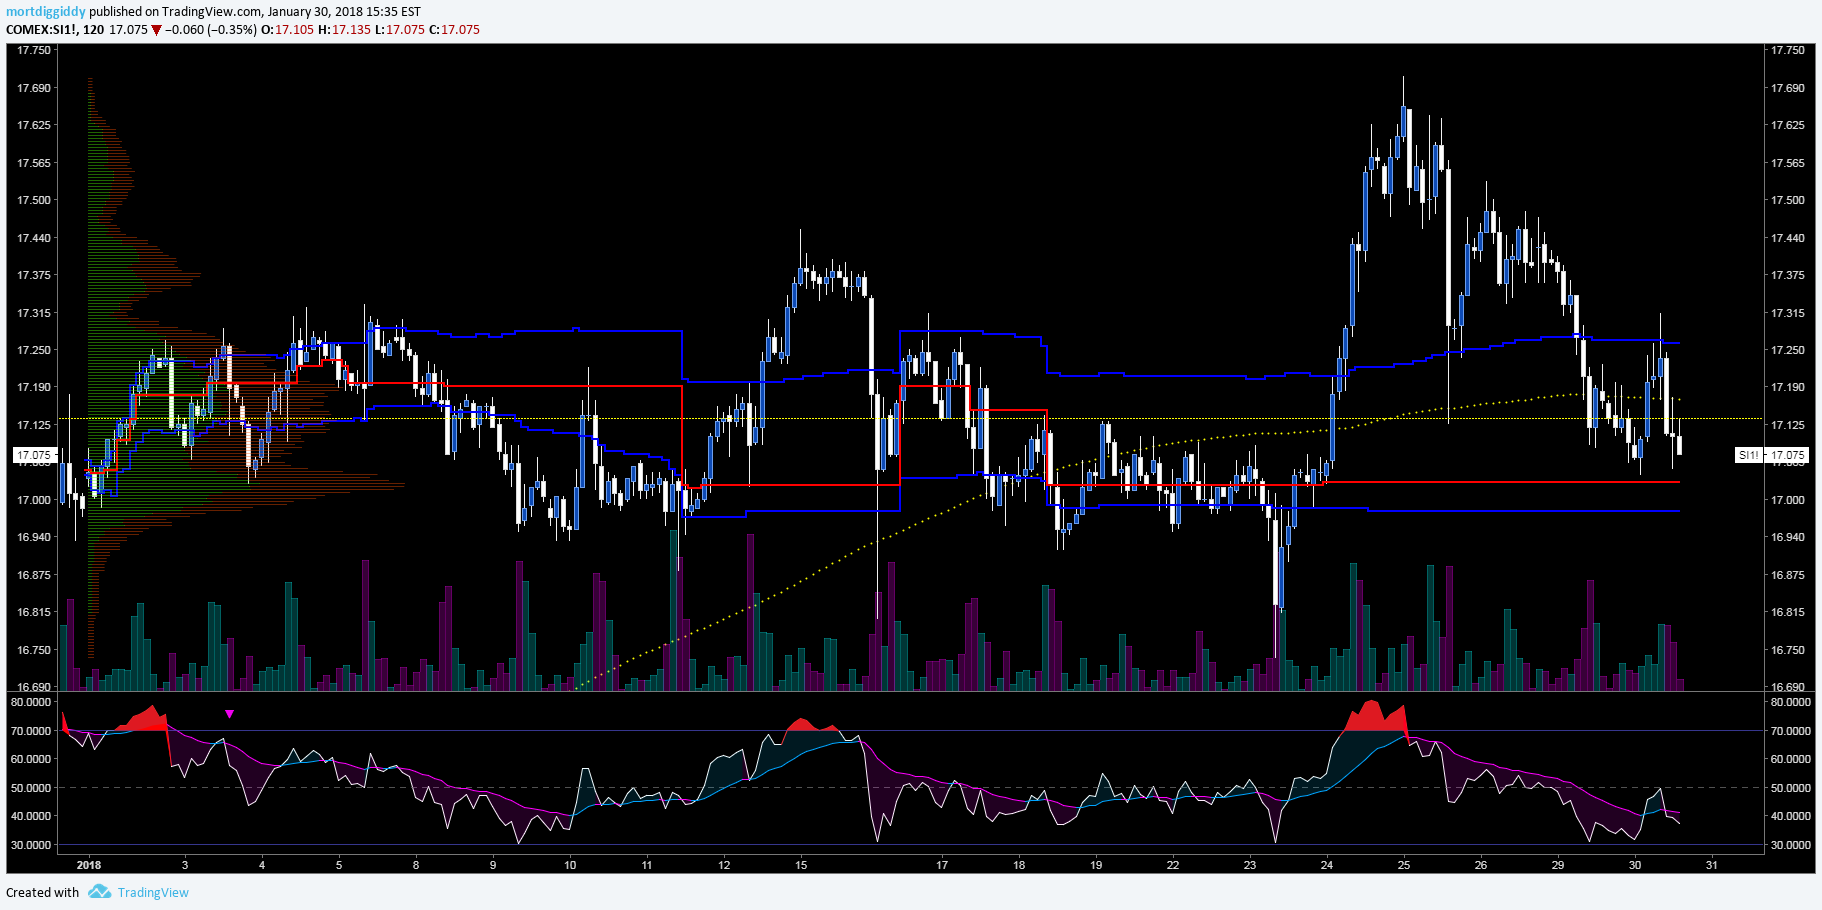
Silver Futures
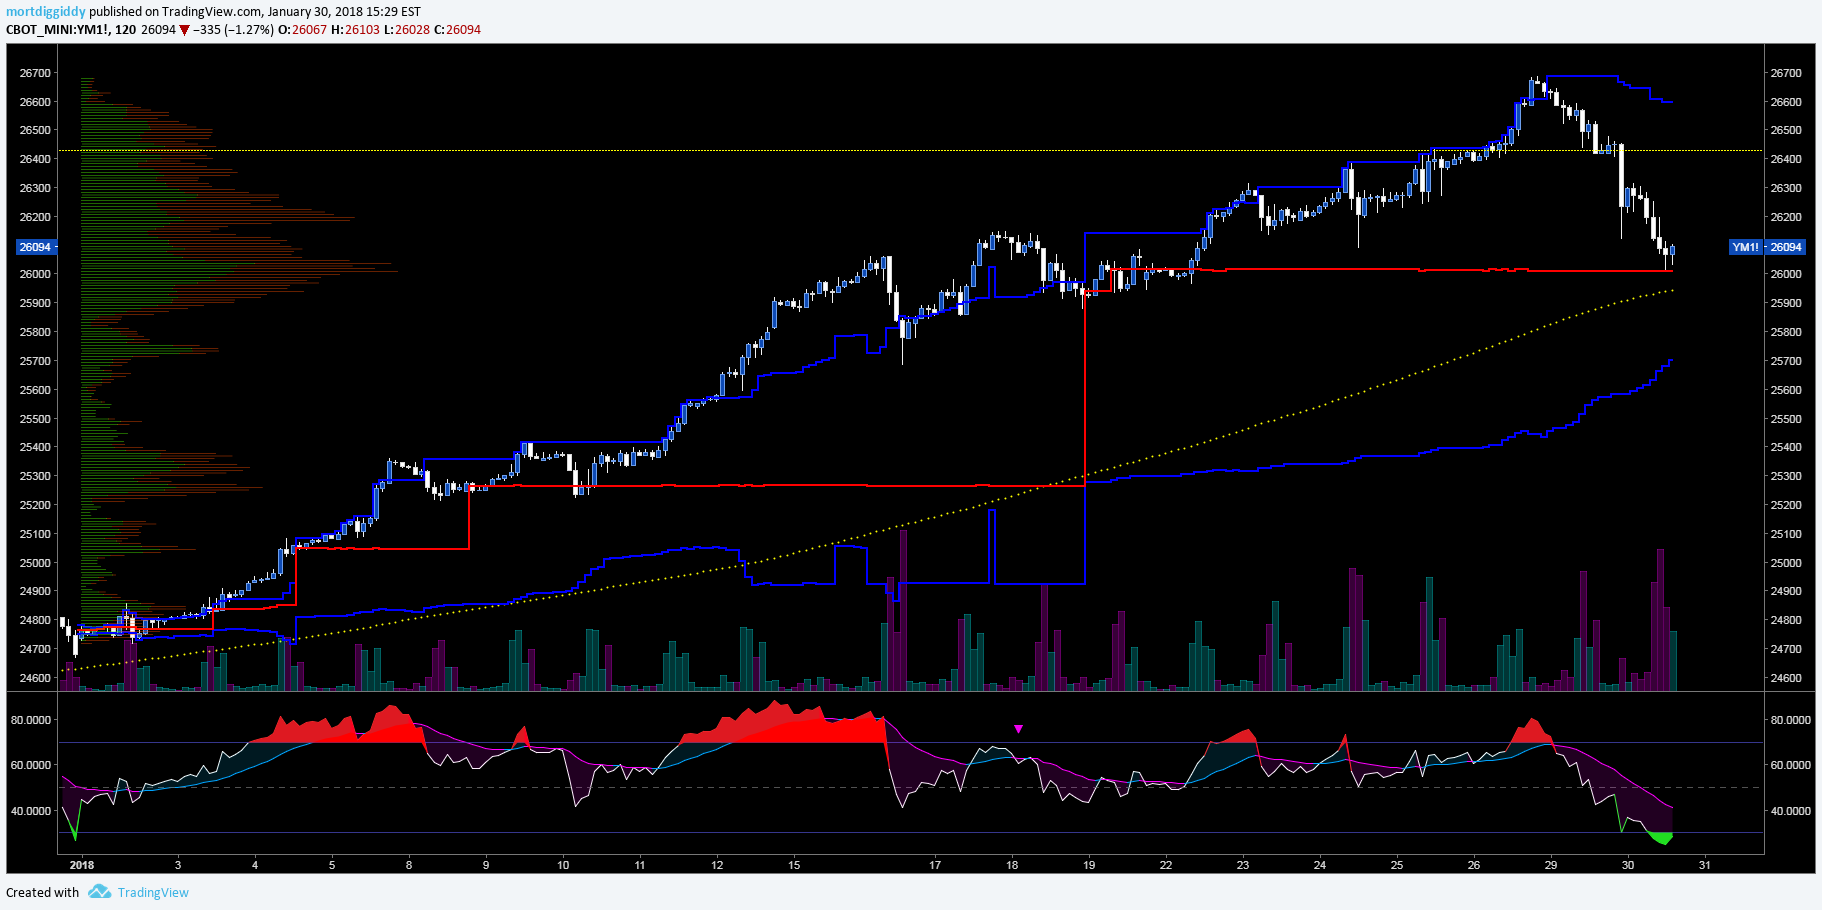
Dow Jones POC and envelope. I expect that this can drop another 100-200 points to the year VWAP… but who knows. I bought this dip today with YM futures.
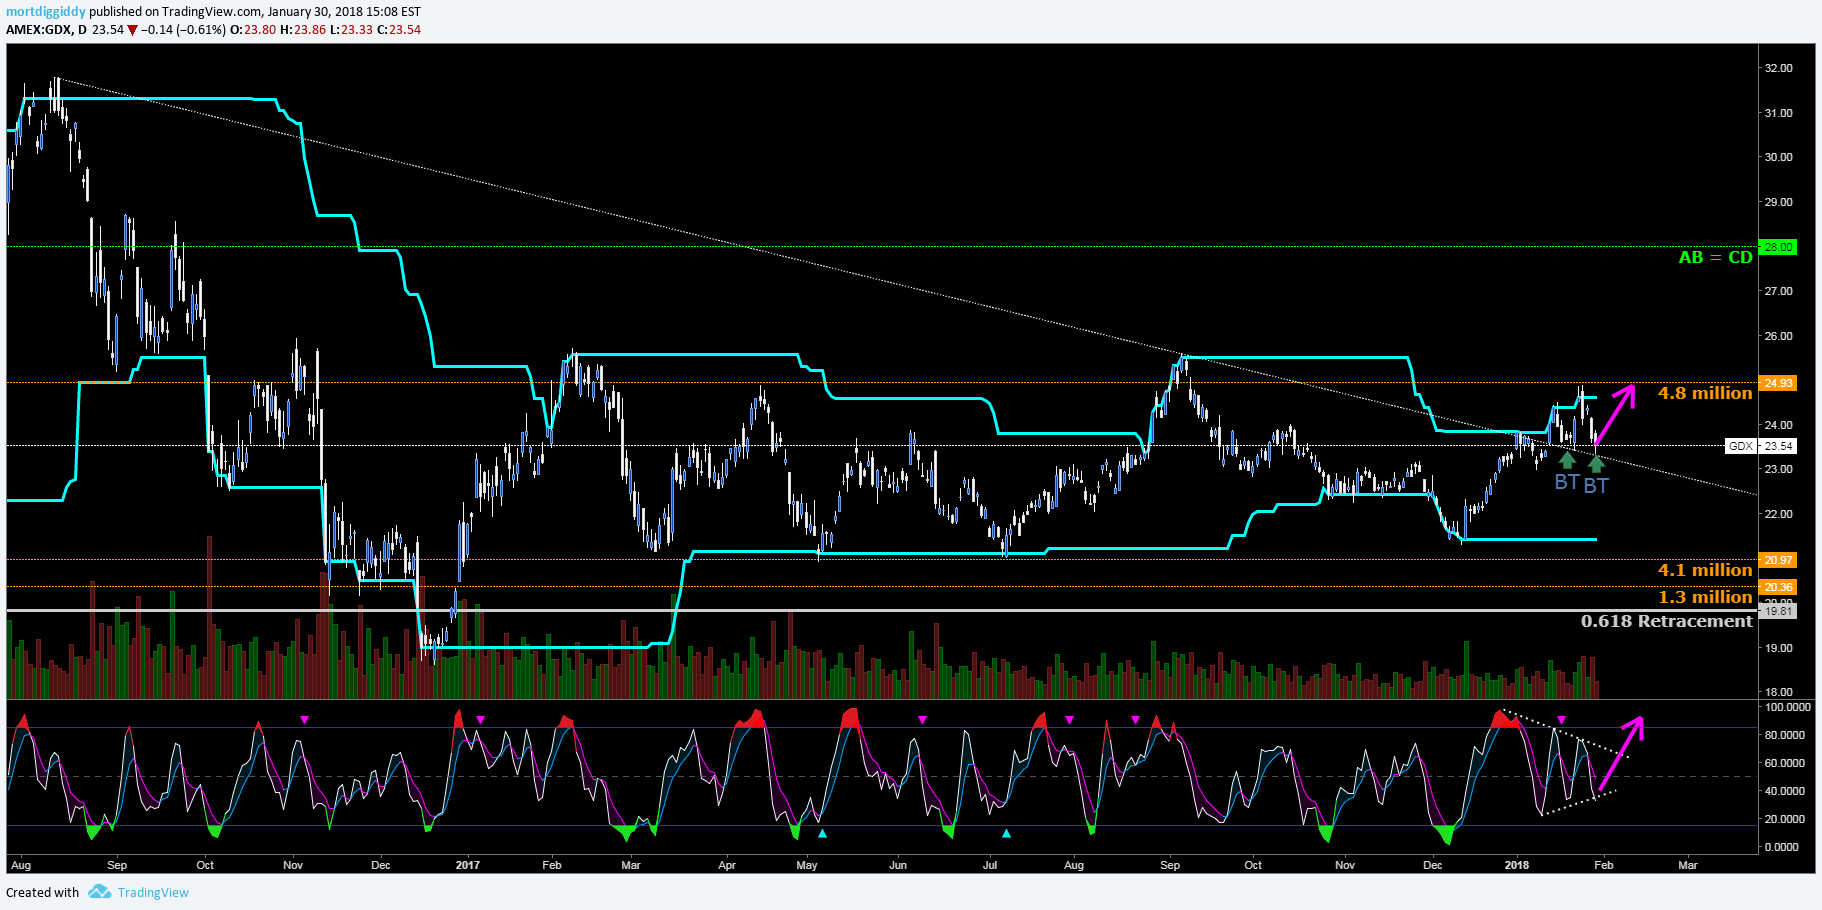
Miners backtest today yet again… modified RSI coiling. My Near term target remains the mega 2016 election dark pool sell block trade just above @ 4.8 million.
Thanks for this
Thanks Morty.
You said a mouthful.
Gotta read it again…maybe several times for this to sink in
🙂
Many thanks for this, Mortdiggiddy. Fascinating.
Market Profiling (volume study?) is one are I wish I’d done more study.
Is a simplistic analysis that the POC is a prior area of support based upon the amount of volume that occured at that price?