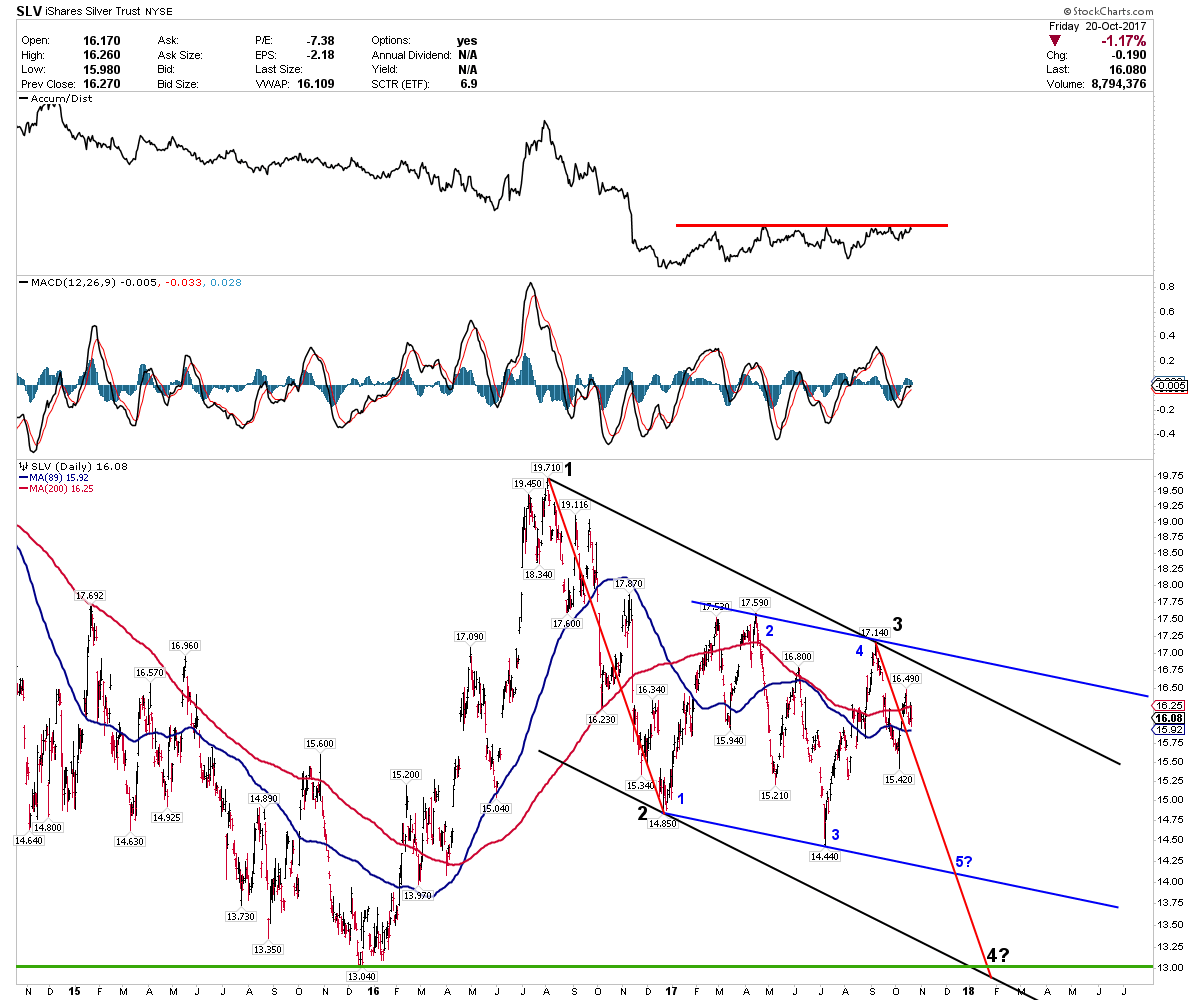
SLV – Daily
Two channels operating – the blue channel exhibiting perfect symmetry. Neither channel bodes well for the bullish case, chartology-wise, at least over the next couple of months.
The only other thing I would note from this chart is how the present time period – from about mid-October through year end – has seen price move sharply lower over the past couple of years. Otherwise, I’m not a “chartology” wiz, so please correct me if I’m wrong!
Very well done RTV
Your chartology is impeccable here.
I applaud you for trying to learn another TA language.
🙂
Note the Black 4 would be an ideal parallel pattern BUt point 4 could very well end up being
at the Blue 5? mark …Rambus always says Point 4 is the most difficult to plot in real time
But once you have it you have your pattern and can watch which way it breaks out.
Good man
Thanks Fully –
Not sure how you figure (blue) Point 5? could turn out to be (black) Point 4?…
Doesn’t there have to be some “pattern” in play, like a channel, triangle, rectangle or even diamond pattern? I don’t see such a pattern at (blue) Point 5? that would provide for your scenario…
OK Here’s what I mean
You don’t know yet where Black Point 4 will be…IF it goes all the way down to your projected bottom black line and then reverses…you are correct that would be a Rectangle pattern . But if it reverses at your bottom blue line around point blue 5 ? then you would draw the pattern like this…It would be a Falling wedge ( not a rectangle)
https://stockcharts.com/h-sc/ui?s=SLV&p=D&yr=2&mn=0&dy=0&id=p55160301581&a=551771184
Falling wedge – yes, of course –
thank you!
As of now I’m expecting the usual miner to rally to begin from 26th December onwards.