Timing and Cycles – Gold
ALL of my personal work remains bearish, including the three most reliable indicators I use from MetaStock. However, the COT numbers show a market that’s mostly liquidated, adding to the risk the shorts are holding right here near 1200. So it’s reasonable to look for a bounce – but unreasonable to expect a low without a change in trading character from Gold.
*************************************************
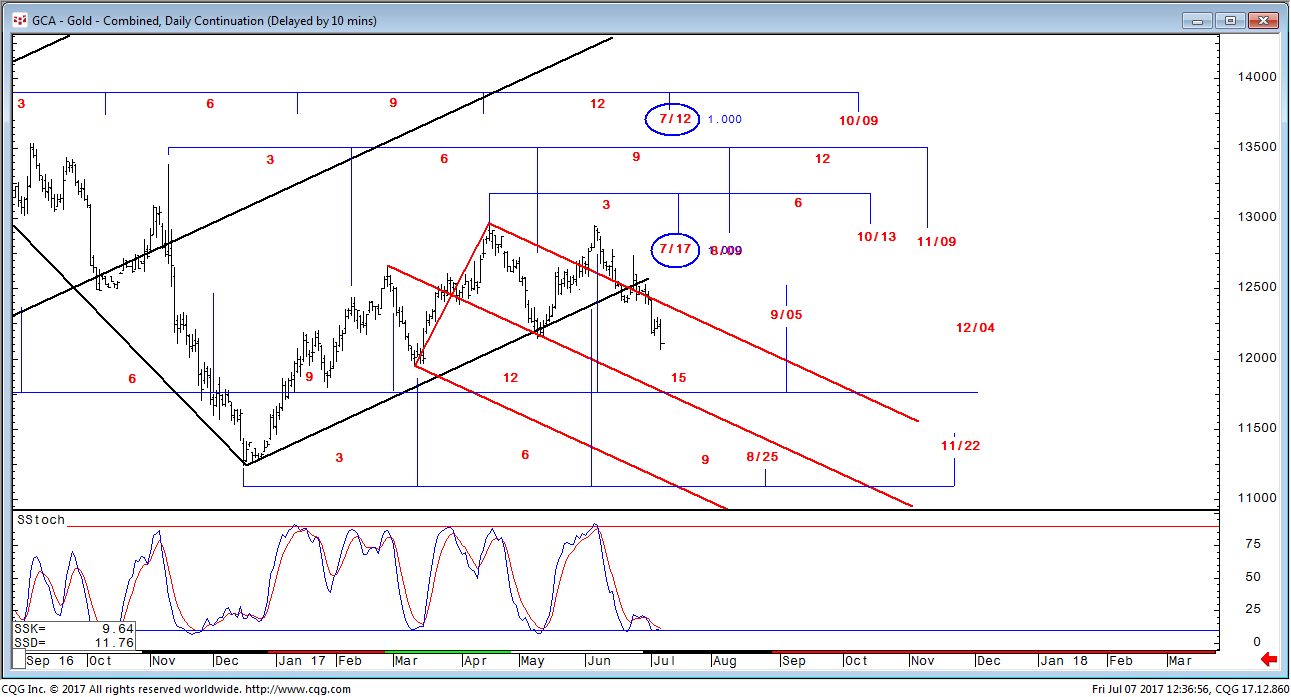
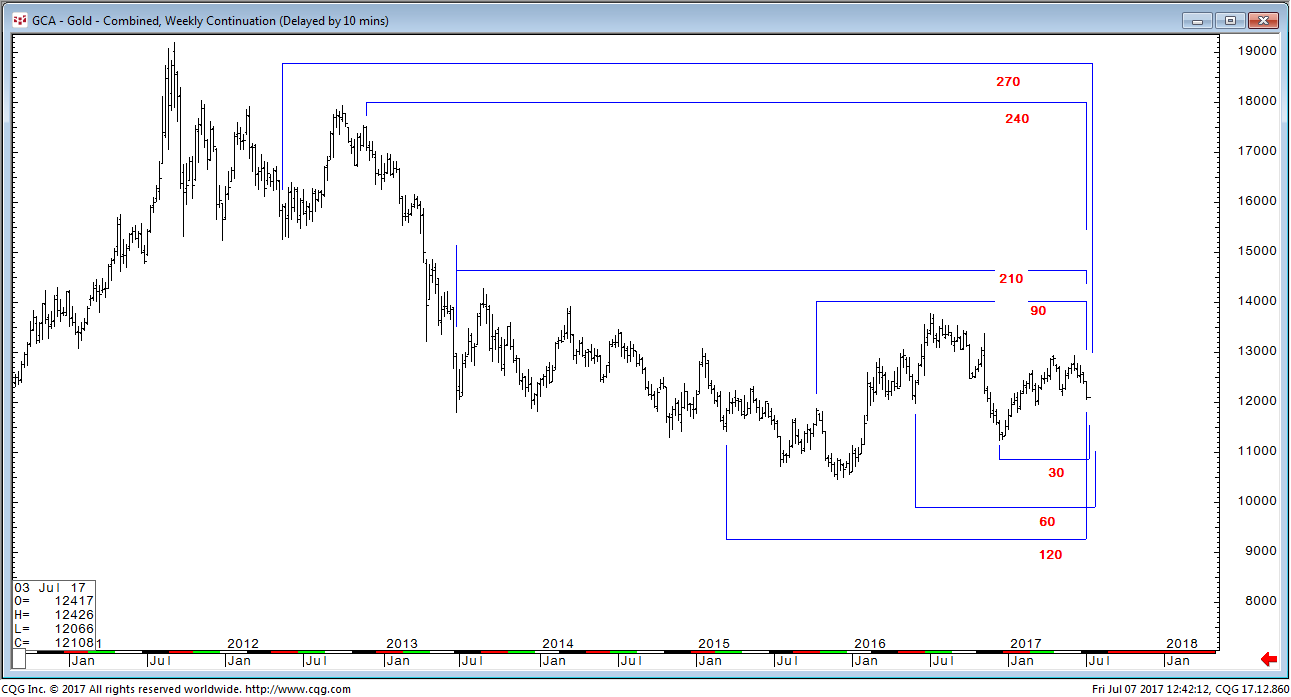
Gold (Comex August ’17)** Weekly and Daily Chart – July 7, 2017
“Support reset to the 1200-1210 range. Resistance 1237 and 1261. Our last comment implied a low was possible July 7th due to a 41 session low-to-low measurement. Below we show the shorter term cycle chart on gold which points to July 12-17 for a possible turn. We went back to research we did on gold in 2013 which showed a tendency to turn on 30 week intervals and multiples of 30 weeks. That is updated on our second chart. Four of the 7 measures “hit” in the week ended today. Combined, all 3 factors suggest the market has entered the window for a low. It is time to start monitoring price more closely for some positives.”
Thanks Boobooman
Appreciate the charts and input
Nice one. Cheers.