Charts To Ponder
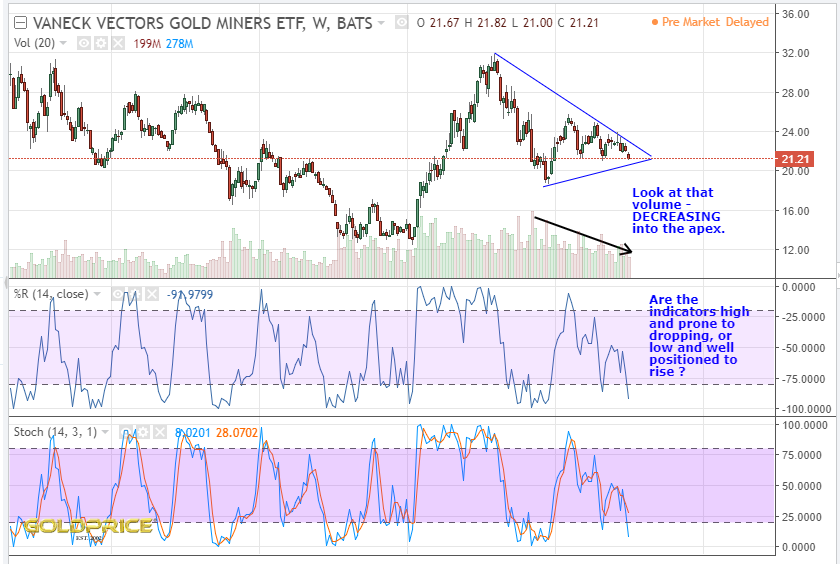
First off – how about GDX. Volume declining into the apex and indicators very low. Of course they can stay low for longer as price continues down…
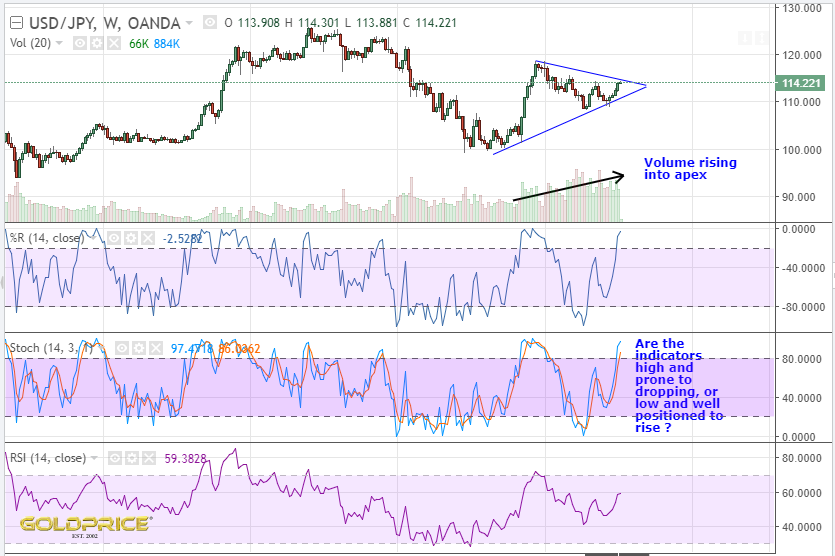
Now the USD/JPY ratio. Volume is rising here, with indicators already high. Traditionally, you see volume decline in a bullish symmetrical triangle, then surge and spike on a confirmed upward breakout.
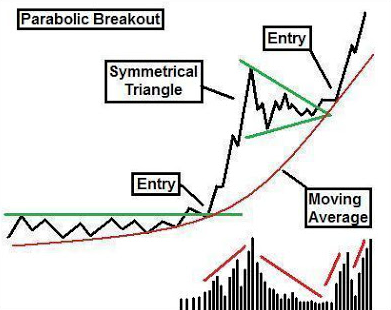
Heres a chart out of a textbook explaining parabolic breakouts…
Interesting similarity in the current gold chart. Just sayin’…
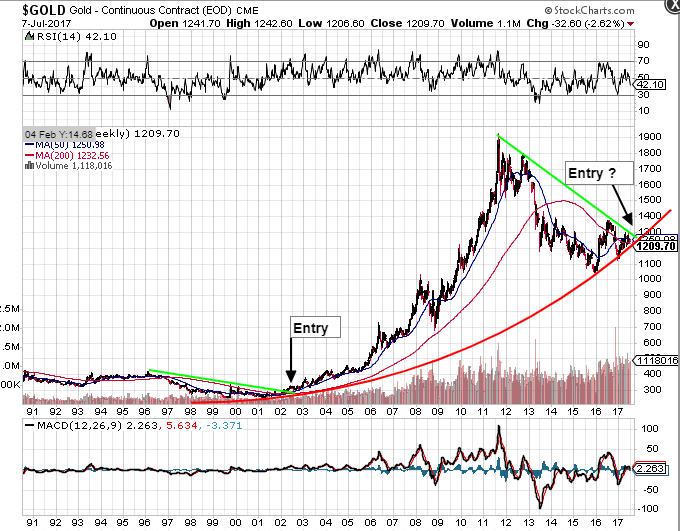
Will we crash and burn, or is the bull still alive ?
NS you are a ray of sunshine in a world of clouds 🙂
Lol. Think my years in meteorology have me looking for the silver lining to every cloud 😉
That does look doable
best to lay low until a real breakout though
Agreed Fully. Cash on the sidelines ready to invest on a confirmed breakout. If it were to occur it would be very, very positive news.