Looking at LT EW counts
It was thinking about a topic on EW as some EW followers showed on this website and others that the gold 2011 Top was a major top as we have major tops in gold every 30 years, so current action should be seen as corrective with next rally to top at 1550 level. Others however like AVI remain in the bullish camp and believe we are in a new bull market.
One thing that does not fit into the bearish theory is the fact that the US$ bottomed /and the Euro topped in 2009 already (CHF however only topped in 2011!). So the questions is was maybe 2008 the top in gold and from 2008-2015 we got and ABC correction or was 2011 the gold top, and what are the implications of that.
This is a chart of gold stocks by elliottwavepredictions.com having both bullish and bearish counts (on website)
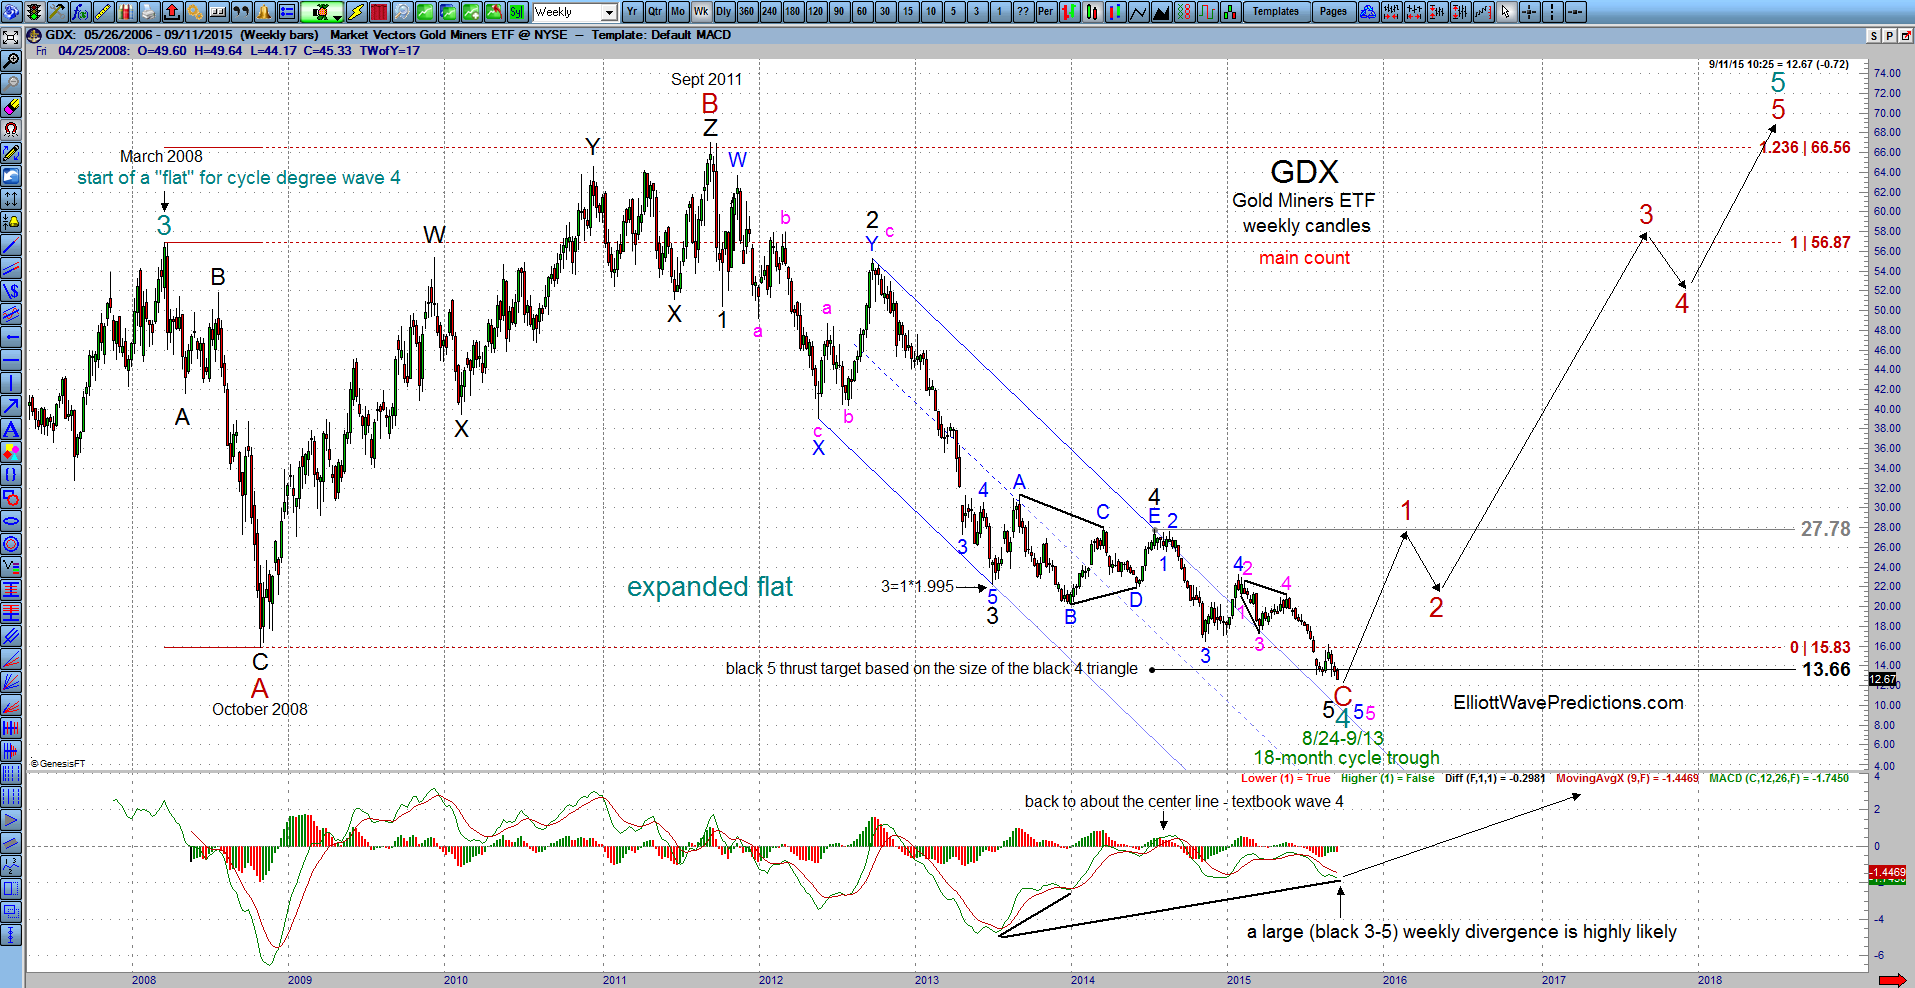
http://elliottwavepredictions.com/http:/elliottwavepredictions.com/category/gold/
As these charts are from last year, better not debate too long on this, but it shows what is possible however.
Other analysts like AVI Gilburt, have different counts and are definitively in the bullish camp:
http://www.marketwatch.com/story/is-it-time-to-call-the-bottom-in-gold-2016-02-11
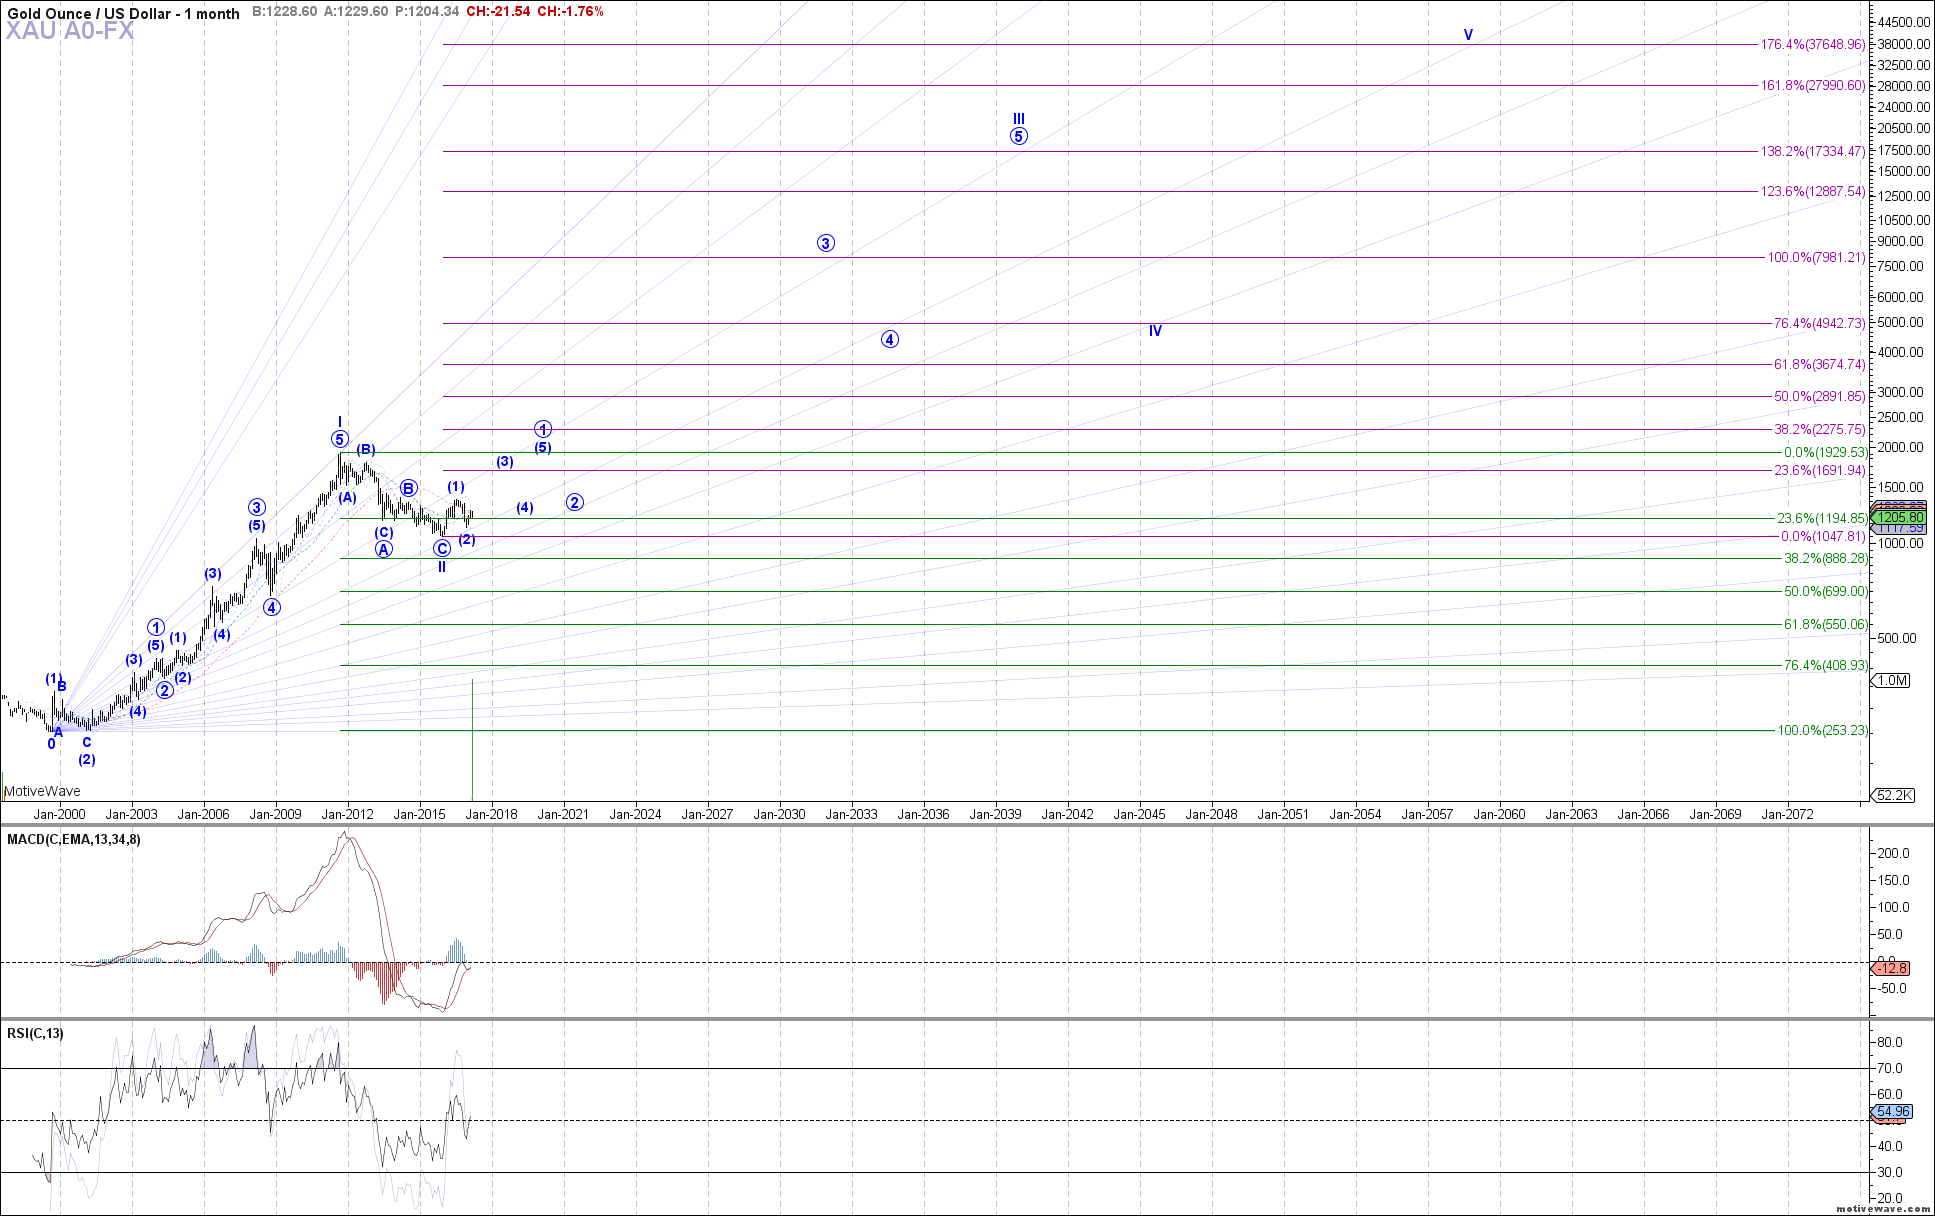
As the previous author AVI saw the top in HUI/GDX in 2008 and action since as an ABC correction.
I definitely prefer an analyst that mainly has one count like AVI, otherwise it looks just like a toss game.
This author ( Enda Glynn,) is seeing as others shown on goldtent before, a B up move in gold to 1550 as next scenario:
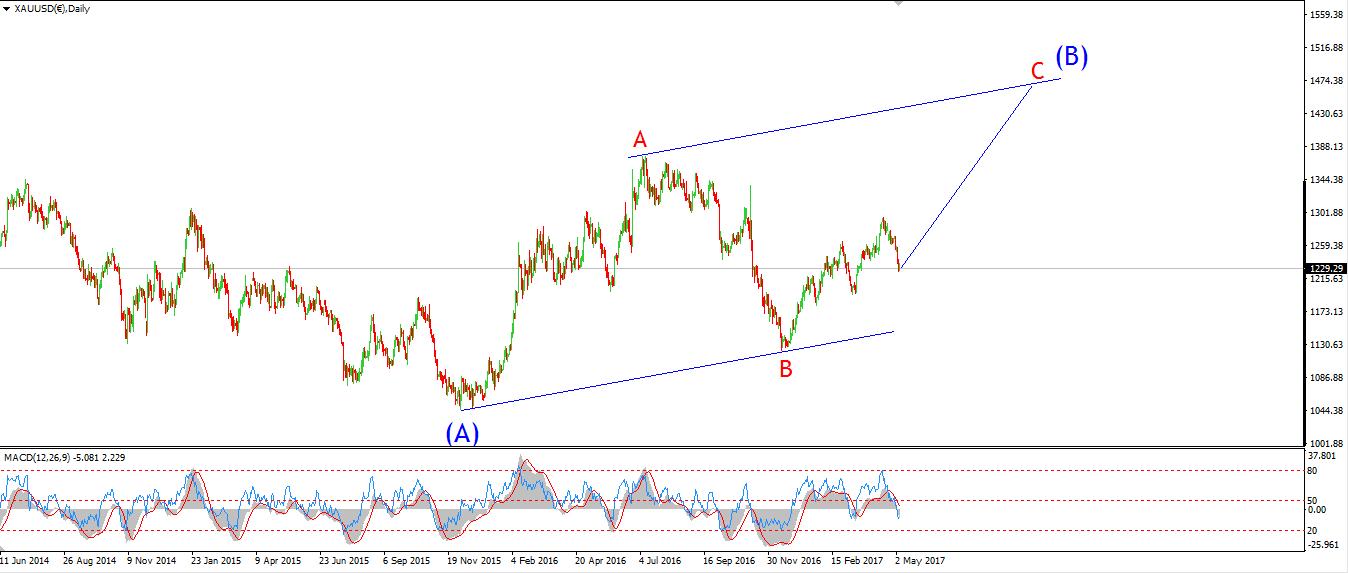
http://www.safehaven.com/article/44254/an-even-more-bullish-wave-count-for-gold
A good video about LT gold cycles and Hurst is the following webinar from 2016: In this webinar cycles like Hurst cycle analysis are used, and since following the author its chart my belief however in Hurst has far diminished as is is too complex for me and not always working, however the overview is very nice:
https://www.youtube.com/watch?v=sFmWerwLHrU&t=2755s
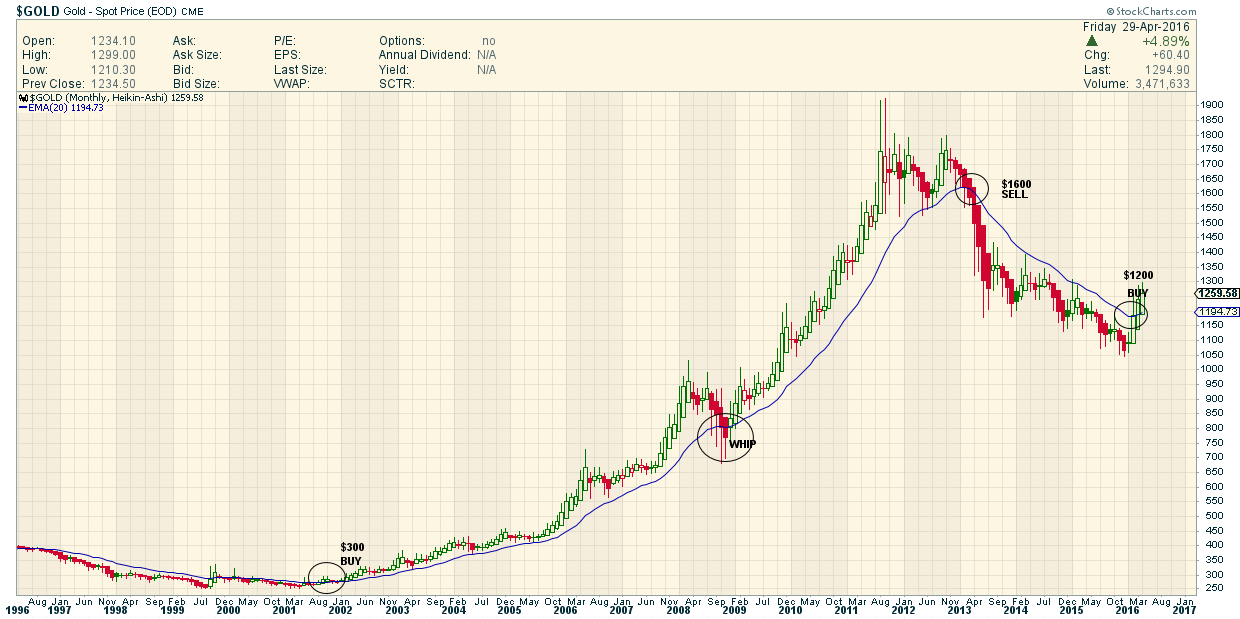
My personal experience is that this is a lot of information and sometimes very confusing, I therefore prefer to stay to basic technical analysis like long term gold charts with weekly/ monthly momentum readings.
Personally I prefer LT charts instead of multiple wave counts, although it is nice to see the possibilities. In the next 2/3 years when gold does not go above 1500-1600 again, I fully trust charts like this to guide me.
EW is useful by giving you ‘if this, then that’ patterns. You are still left with “if” though.
I FOLLOW EW analysis done by others. But I use my own system of tools to try to validate or invalidate EW counts I see. I follow no one, dogmatically.
Glynn’s pattern at the macro level .. is precisely what I am on … as well as Sam, Daneric, ElliottCharts, and most other EWers I know. Aside from Avi and Sid.
I don’t want to disparage other analysts .. I do see names tossed aside here and there on occasion (Savage, Rosen). Never hurts to consider other ideas. But track records matter.
Personally, the bullish counts make sense only if you CAN DISREGARD price action before 2000.
Bullish counts don’t work well if you decide to consider them. Very few take the time to go back further. Big mistake, imo.
Pedro, I never looked at it this way, interesting. What is your take on the possible break out of triangle in gold, because once we break out on weekly basis we should reach 1700$ gold in 1/2 years, isn’t that far above the 1500 levels a B wave rally could reach, so could gold then be in bullish camp again?
Thanks Alex very useful.
Great stuff Alex. The simple measurement of the wedge/pennant breakout also targets approx $1550.
I believe it all comes down to the fact that either 2011 was the 30 year top in gold and we will retrace back to 1550$ or not. I doubt that after a 4 year bear market we will only go to 1550$ as the pent up energy should give at least a re test of highs.
“2011 was the 30 year top in gold”
or
2011 was the 40 year top in dollar based CREDIT (as well as gold). And everything else follows from that.
A 40 yr bull isn’t going to be corrected in half a decade.